Sales and Income Statement Table Slide for Financial Planning
RJ0400058_25
- Last Update 06/02/2025
- File Size 1.4MB
- # of Slides 2
- File Format PPTX
- Slide Ratio 16:9
- Color
Keywords
About the Product
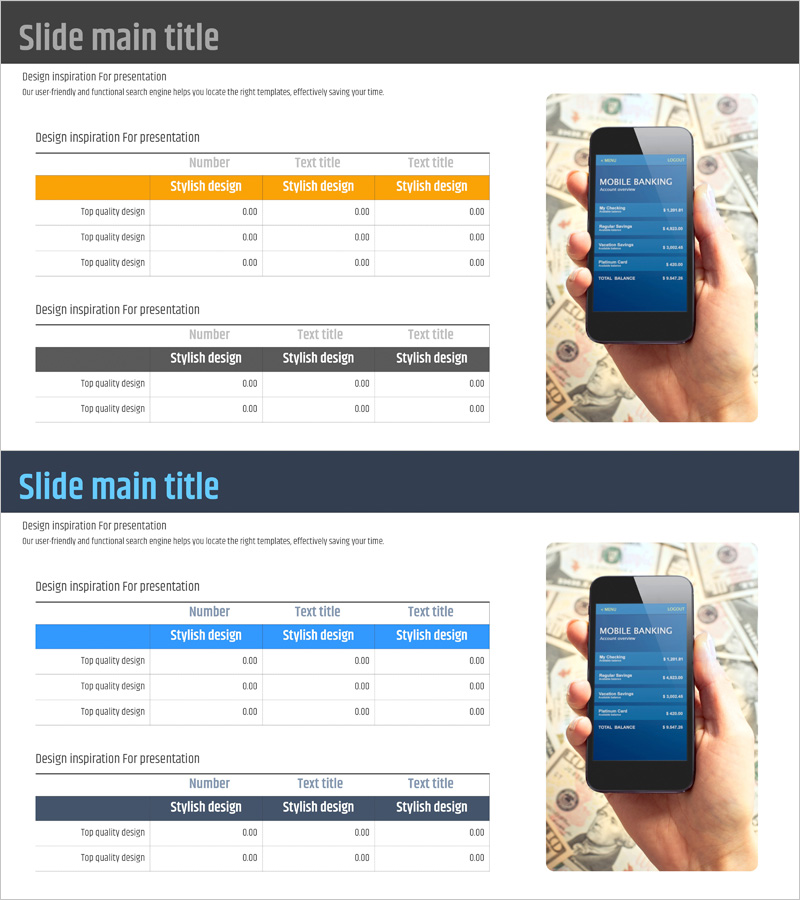
A PowerPoint slide designed for presenting financial data in investment pitches and business planning presentations. Features a dual-table structure with orange and gray headers to clearly compare sales figures, costs, and profit metrics. Each table includes 3-column text input areas and multiple data rows for organizing key financial indicators. The right side displays a mobile banking app interface, making it suitable for fintech and financial services presentations. Available in 16:9 widescreen PPTX format for immediate editing and customization.
Usage Points
-
Main Usage
Essential for investor relations materials, business plans, and investment proposals where financial performance and projections must be presented numerically. Organizes revenue, cost of goods sold, and net profit in table format to communicate financial health clearly to decision-makers and investors.
-
How to Use
Enter period or year labels in the 'Text Title' areas of each table, then input financial line items such as revenue, expenses, and net income in the rows. Add numerical data and adjust colors to highlight key metrics. For fintech presentations, leverage the mobile banking image on the right to add digital financial service context.
-
Recommended For
CFOs, finance managers, and investor relations professionals presenting quarterly or annual financial results. Ideal for startup fundraising pitches, corporate earnings presentations, and financial consulting proposals where data-driven credibility is essential.
-
Slide Structure
Two slides total, each containing one title area, one descriptive text section, and two data tables with 3 columns and 3+ rows. Orange and gray headers distinguish different financial categories, enabling clear organization of revenue, expenses, and profitability metrics.
Related Products
-

Profit and Loss Statement Slide – Calculating Investment Business Sales and Profits
#Financial Plans and Performance #Diagram #Income Statement
-

Sales and Profit Table – Clear Visualization of Financial Planning
#Financial Plans and Performance #Diagram #Other
-

Sales and Profit Table Diagram
#Financial Plans and Performance #Diagram #Income Statement
-

Illustration Theme Income Statement Table – A Fresh Perspective on Financial Data
#Financial Plans and Performance #Diagram #Income Statement
