Fintech Business Area Diagram – Visualizing Business Overview
RJ0400058_22
- Last Update 06/02/2025
- File Size 0.2MB
- # of Slides 2
- File Format PPTX
- Slide Ratio 16:9
- Color
Keywords
- #Content-Based Slides
- #Design-Based Slides
- #Company Introduction
- #Business Introduction
- #Diagram
- #Business Areas
- #Business Areas
- #Flow
- #Spread
- #Circular Flow
- #Decentralized Diagram
- #16:9
- #radial diagram PowerPoint
- #3-node diagram slide
- #business area visualization
- #fintech presentation template
- #business structure diagram PowerPoint slide
About the Product
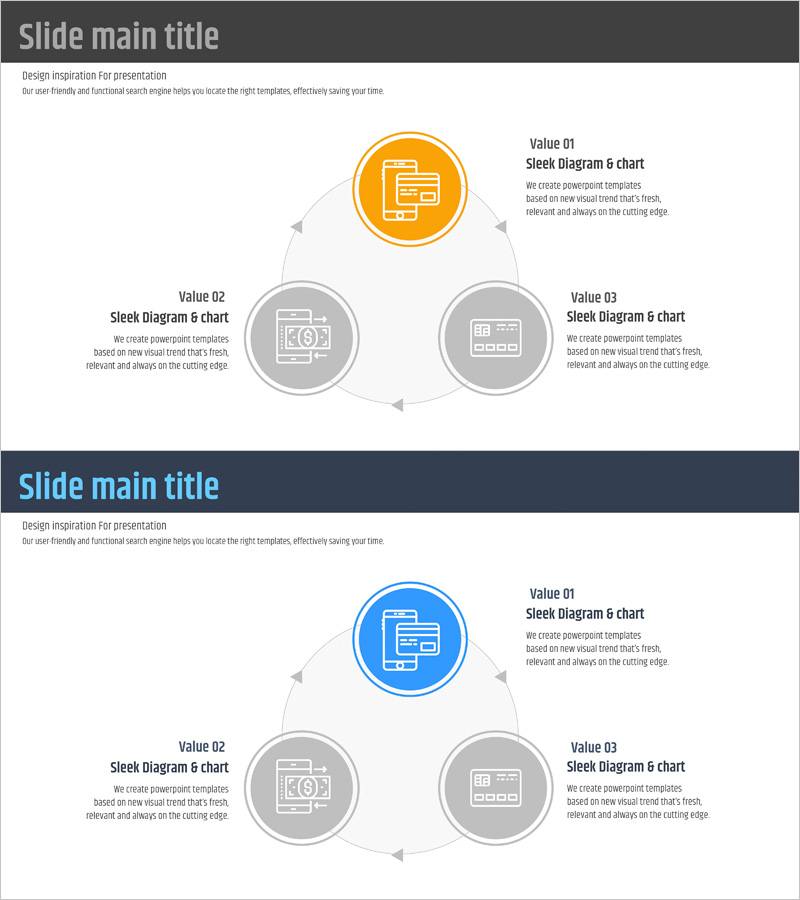
A radial diagram PowerPoint slide with a central node expanding to three directions, ideal for visualizing business areas, core values, and business models. The design features an orange accent node and gray supporting nodes with space for icons and text in each element. Arrow connectors clearly show relationships between components, making it effective for business presentations and corporate overview documents. The 2-slide set offers two color variations—orange and blue—allowing you to match your brand identity. Perfect for presenting hierarchical information and strategic frameworks in a visually intuitive manner.
Usage Points
-
Main Usage
Visualize three key business components radiating from a central concept. The design emphasizes the relationship between a core idea and supporting elements, making complex business structures immediately understandable to your audience.
-
How to Use
Place your main topic in the orange central node and supporting details in the gray side nodes. Customize icons to match your industry or theme, then add descriptive text. Works well for business overviews, product strategies, organizational structures, and strategic frameworks.
-
Recommended For
Ideal for fintech, IT, and financial services presentations, startup pitch decks, executive reports, and strategic planning documents. Recommended for business strategists, product managers, marketing professionals, consultants, and C-level executives who need to communicate multi-faceted business concepts.
-
Slide Structure
2-slide set. Each slide contains one central orange circular node and two gray circular supporting nodes connected by directional arrows. Each node includes space for an icon and text content. Two color schemes provided: orange-gray and blue-gray combinations for brand flexibility.
Related Products
-

Presentation Slides Using Diagrams and Charts – Innovation and Efficiency
#Company Introduction #Business Introduction #Diagram
-

Travel Business Relationship Diagram – Innovative Business Model
#Company Introduction #Business Introduction #Diagram
-

Business Introduction with Square Connection Diagram
#Company Introduction #Business Introduction #Diagram
-

Soft Power Sector Diagram – Optimized for Business Introduction
#Company Introduction #Business Introduction #Diagram
