Fintech Development Status Graph – Market Share Analysis
RJ0400058_16
- Last Update 06/02/2025
- File Size 0.2MB
- # of Slides 2
- File Format PPTX
- Slide Ratio 16:9
- Color
Keywords
- #Content-Based Slides
- #Design-Based Slides
- #Product/Service Introduction
- #Market and Competitor Analysis
- #Graph
- #Development Status
- #Market Share
- #Circles
- #Doughnut Chart
- #16:9
- #donut chart PowerPoint slide
- #pie chart presentation template
- #market share analysis graph
- #ratio visualization slide
- #fintech development status chart
- #circular graph PowerPoint download
About the Product
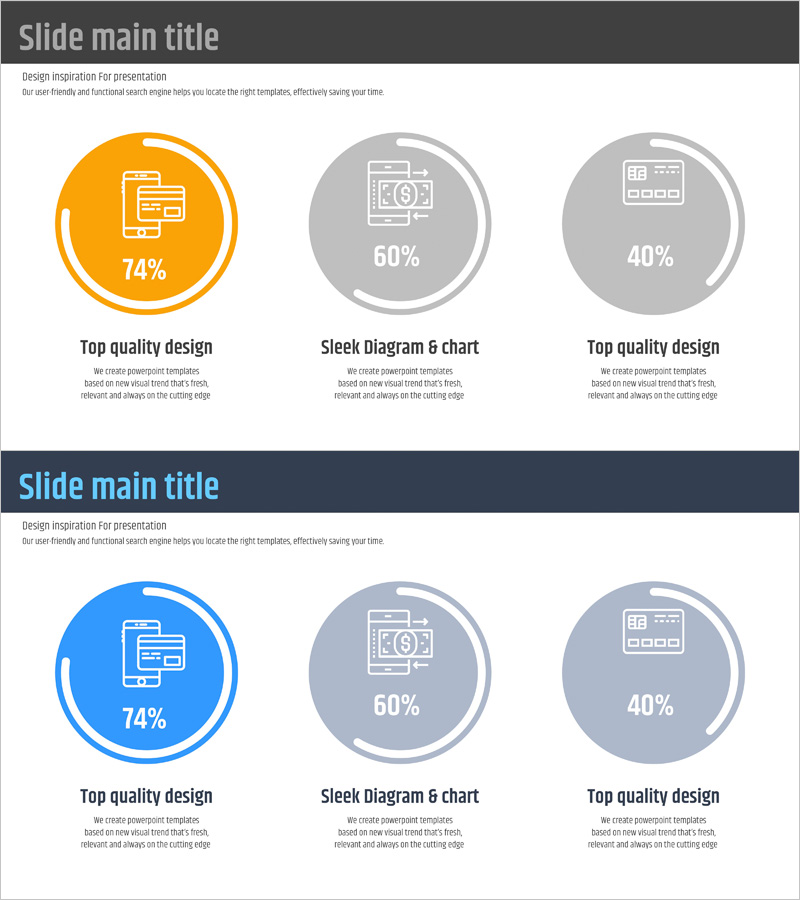
A donut chart PowerPoint slide visualizing fintech market status across three segments with percentage data. The design features a two-tone color scheme (orange and gray backgrounds) with white icons and percentage values, making it ideal for displaying market share, development status, and technology distribution. Two-slide layout provides color variations (orange and blue) for comparing multiple metrics side by side. Ready-to-use for financial and IT presentations, business analysis reports, and market research decks.
Usage Points
-
Main Usage
Visualize fintech market share, technology distribution, and development metrics across three segments. The donut structure emphasizes core percentages in the center while clearly displaying each segment's proportion, enhancing audience comprehension of comparative data.
-
How to Use
Apply to financial and IT company business reports, market analysis presentations, and investor relations materials. Use the orange slide to highlight positive performance and the blue slide for technology innovation or market trend discussions. Easily edit text and percentages to adapt to various ratio datasets.
-
Recommended For
Financial and fintech executives, investor relations managers, market analysts, business development teams, and consulting professionals. Suitable for quarterly earnings presentations, market overview discussions, competitive analysis, and technology roadmap sharing.
-
Slide Structure
Two-slide layout. Each slide features a three-segment donut chart (displaying 74%, 60%, and 40% data), segment-specific icons (mobile, camera, dashboard), title area, and descriptive text section. First slide emphasizes orange accent; second slide features blue accent for visual variation.
Related Products
-

Sales Status Analysis Graph – Simple and Stylish Design
#Product/Service Introduction #Market and Competitor Analysis #Graph
-

Development Status Analysis Donut Chart – Market Share Visualization
#Product/Service Introduction #Market and Competitor Analysis #Graph
-

Analysis of Work Progress – Utilizing Pie Chart
#Product/Service Introduction #Market and Competitor Analysis #Graph
-

Space Exploration Donut Pie Chart
#Product/Service Introduction #Market and Competitor Analysis #Graph
