Visualize Market Analysis with 3D Area Graph
RJ0400057_26
- Last Update 06/02/2025
- File Size 0.1MB
- # of Slides 2
- File Format PPTX
- Slide Ratio 16:9
- Color
Keywords
About the Product
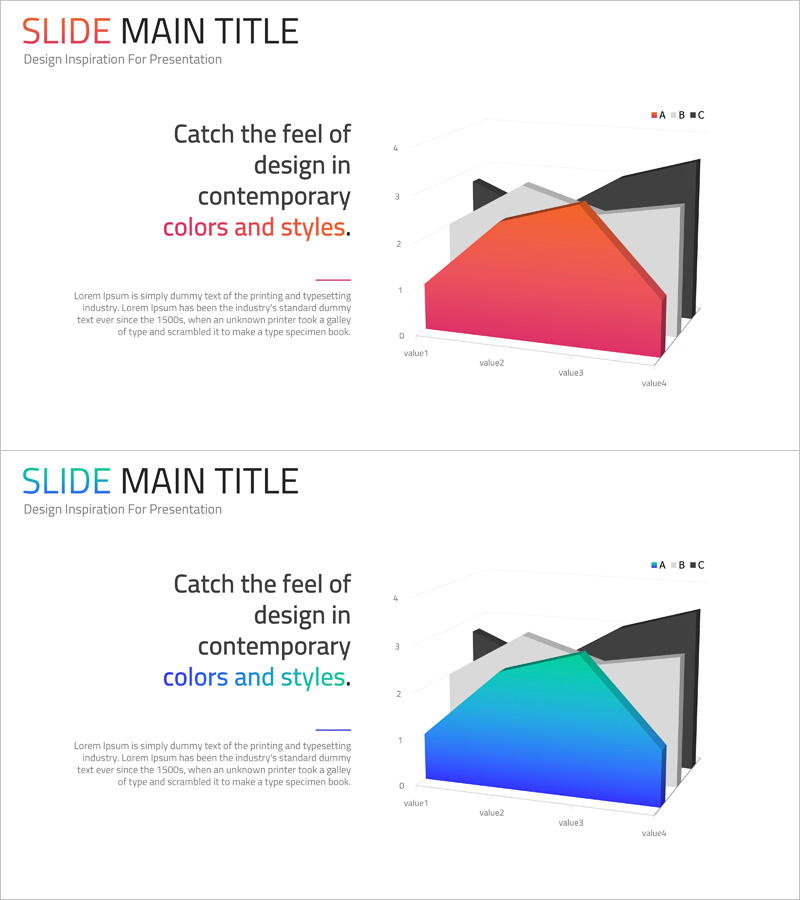
A professional 3D area graph PowerPoint slide designed for competitive advantage analysis and market data visualization. The dual-tone color scheme featuring orange and blue creates an impactful three-dimensional representation of market metrics. The left side provides ample text space for analysis descriptions, while the right side showcases the 3D area graph with four data points. This 2-slide set includes alternative color combinations (orange, blue, and gray) for flexible presentation customization. Ideal for market share comparisons, competitor benchmarking, and revenue trend analysis in business presentations and reports.
Usage Points
-
Main Usage
Visualize market data, competitor analysis, and market share comparisons using an impactful 3D area graph that enhances audience comprehension. This slide strengthens data credibility in investor presentations, executive briefings, and strategic planning meetings.
-
How to Use
Enter your analysis title and description in the left text area, then update the 3D area graph with actual market data. Use the legend (A, B, C) to compare up to three data categories, and adjust color combinations to match your corporate branding guidelines.
-
Recommended For
Perfect for business plans, investor pitch decks, quarterly earnings reports, marketing strategy presentations, and market research documents. Recommended for finance teams, strategy departments, and marketing professionals presenting data-driven insights.
-
Slide Structure
Two-slide set with identical layouts featuring different color emphasis—first slide highlights orange tones, second emphasizes blue. Each slide contains a left text input area (title, subtitle, description) and a right-side 3D area graph displaying four data points with labeled axes.
Related Products
-

Mobile App Competitor Analysis – Visualizing Market Share
#Market and Competitor Analysis #Graph #Other
-

Vertical Bar Chart Slide for Business Competitive Advantage Analysis
#Market and Competitor Analysis #Graph #Other
-

Area Graph for Business Area Analysis
#Market and Competitor Analysis #Graph #Other
-

Area Graph – Effective Visualization for Market and Competitor Analysis
#Market and Competitor Analysis #Graph #Other
