Korea China Japan Analysis Graph – Market Competitive Advantage
RJ0300055_14
- Last Update 05/03/2025
- File Size 3.5MB
- # of Slides 2
- File Format PPTX
- Slide Ratio 16:9
- Color
Keywords
- #Content-Based Slides
- #Design-Based Slides
- #Market and Competitor Analysis
- #Graph
- #Other
- #Competitor Analysis
- #Competitive Advantage
- #Line
- #Line Chart
- #Map
- #16:9
- #Asia map PowerPoint slide
- #world map presentation template
- #market analysis chart
- #competitive analysis graph
- #geographic data visualization
About the Product
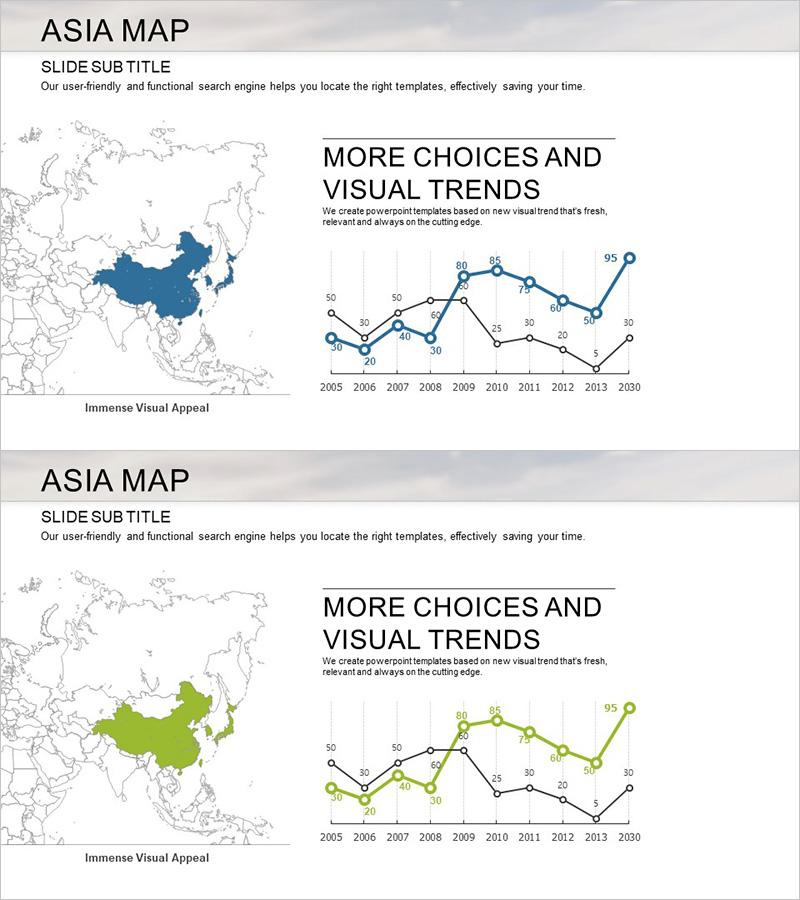
A 2-slide PowerPoint presentation designed for Asia-Pacific market analysis and competitive positioning. The first slide features an Asia map with China highlighted in dark blue, paired with a multi-line trend chart spanning 2005 to 2030. The second slide presents the same geographic layout with China in lime green, accompanied by a multi-series line graph for competitor benchmarking. Delivered in 16:9 widescreen PPTX format with fully editable map colors and chart series. Ideal for business presentations, market research reports, competitive advantage strategies, and regional performance analysis in investment pitches and strategic planning documents.
Usage Points
-
Main Usage
Simultaneously visualize geographic market scale, growth rates, and competitor market share across Asia-Pacific regions. The map's color-coded country highlighting (dark blue and lime green variants) emphasizes strategic importance of specific markets, while multi-series line graphs enable effective comparison of complex time-series data across multiple competitors or metrics.
-
How to Use
Use the first slide for Asia market overview and China's key performance indicators introduction. Deploy the second slide for competitive benchmarking analysis or multi-year trend comparison. Customize map colors (dark blue, lime green) and chart series colors to match corporate brand guidelines, ensuring visual consistency throughout your presentation deck.
-
Recommended For
Executive reports, investor relations pitches, business plans, marketing strategy presentations, and market research reports—particularly for Asia market entry strategies, global expansion plans, and competitive advantage analysis. Ideal for C-suite executives, strategy managers, marketing directors, and sales leaders presenting regional performance and market positioning.
-
Slide Structure
2-slide layout with left-aligned Asia continent map (country borders, highlighted nation in accent color) and right-aligned multi-series line chart (2005–2030 timeline, 3–4 data series with marked data points). Central white space balances map and chart visual weight, creating a professional two-column composition.
Related Products
-

Comparative Analysis Line Graph – Highlighting Competitive Advantage
#Market and Competitor Analysis #Graph #Competitor Analysis
-

Line Graph for Comparative Analysis – Highlighting Competitive Advantage
#Market and Competitor Analysis #Graph #Competitor Analysis
-

Default Line Graph for Market & Competitor Analysis – Competitive Advantage
#Market and Competitor Analysis #Graph #Competitor Analysis
-

Comparative Analysis Line Graph – Market and Competitor Analysis
#Market and Competitor Analysis #Graph #Competitor Analysis
