Competitive Comparison Area Diagram – Visualizing Market Advantage
RJ0400060_27
- Last Update 06/03/2025
- File Size 0.3MB
- # of Slides 2
- File Format PPTX
- Slide Ratio 16:9
- Color
Keywords
About the Product
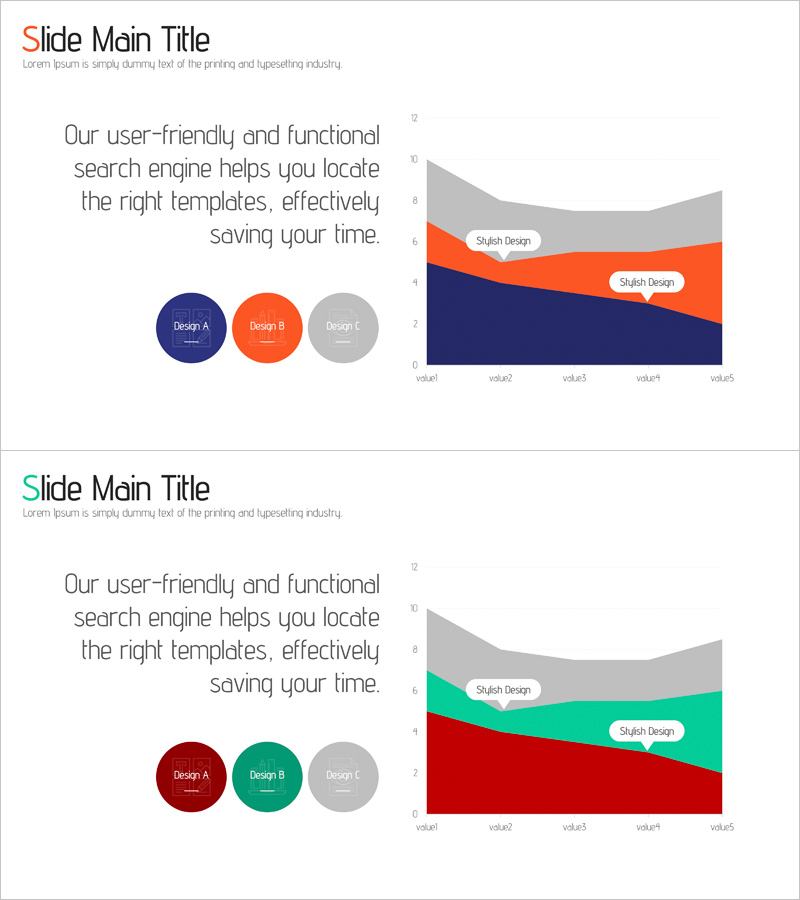
A PowerPoint slide featuring an area diagram that visually represents market advantage through competitive comparison. The layered area chart uses navy, orange, and gray colors to intuitively convey comparative data against competitors. The slide is structured with a text input area on the left for descriptions and a data-driven area chart on the right, creating a two-stage layout. Three circular icons highlight key design elements and comparison factors. Designed in 16:9 widescreen format for modern presentation environments, this slide is ready for immediate use in competitive analysis, market share reporting, and product advantage presentations.
Usage Points
-
Main Usage
This slide compares market share, product performance, and pricing advantages against competitors using an area chart format. The three-color layered structure (navy, orange, gray) clearly prioritizes data, while the two-column layout combines explanatory text on the left with visual data representation on the right.
-
How to Use
Enter competitive analysis content in the left text area (such as technology, pricing, or market share), then update the area chart data values with actual figures. Modify the three circular icon labels to reflect your competitive factors. Use this slide in investor presentations, strategy meetings, and marketing reports to emphasize competitive advantages.
-
Recommended For
Ideal for strategy planning teams, marketing departments, sales teams, and executives presenting competitive analysis results. Particularly suited for investor relations materials, business plans, market analysis reports, and product launch presentations where competitive positioning is critical.
-
Slide Structure
Two-slide set with identical layouts: each slide features a left-side text input area and a right-side area chart, creating a balanced two-column design. Title and subtitle areas appear at the top, with three circular icons positioned at the bottom to indicate comparison factors. The 16:9 widescreen format ensures optimal readability across all display environments.
Related Products
-

Progress Comparison Graph – Strategic Visualization for Market Competition
#Market and Competitor Analysis #Graph #Other
-

Business Program Analysis Area Graph – Competitive Edge
#Market and Competitor Analysis #Diagram #Graph
-

Area Graph – Effective Visualization for Market and Competitor Analysis
#Market and Competitor Analysis #Graph #Other
-

Goal Achievement Analysis Area Graph – Data-driven Competitive Edge
#Market and Competitor Analysis #Graph #Other
