Comparison Graph of Yearly Trends – Market and Competitor Analysis
RM0100011_10
- Last Update 01/28/2025
- File Size 1MB
- # of Slides 2
- File Format PPTX
- Slide Ratio 16:9
- Color
Keywords
- #Content-Based Slides
- #Design-Based Slides
- #Market and Competitor Analysis
- #Diagram
- #Graph
- #Competitor Analysis
- #Competitive Advantage
- #Table
- #Line
- #Standard Table
- #Line Chart
- #16:9
- #line chart PowerPoint slide
- #dual-series trend comparison
- #annual data visualization
- #market analysis presentation
- #competitor comparison chart
- #PowerPoint template download
About the Product
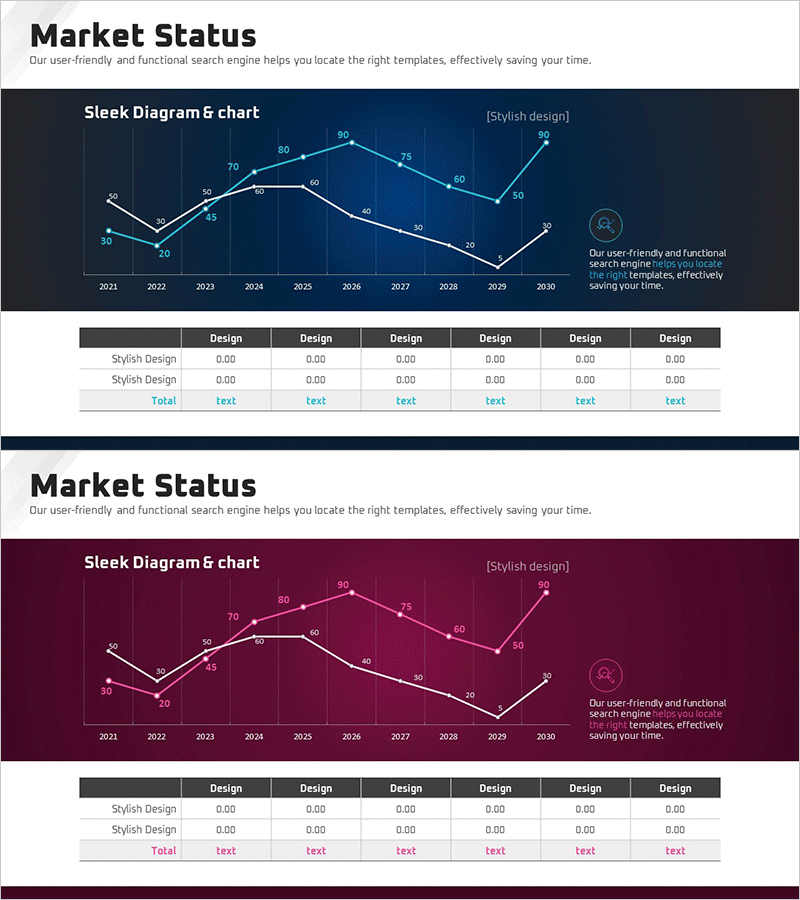
A dual-series line chart PowerPoint slide comparing annual trends from 2021 to 2030, ideal for market status and competitor analysis presentations. The dark blue background features light blue and white lines representing two data sets, allowing simultaneous visualization of market performance and competitive positioning. This 16:9 widescreen, 2-slide template is fully editable with automatic chart updates when data is modified. Perfect for business analysis, marketing reports, and executive presentations requiring trend comparison and performance benchmarking.
Usage Points
-
Main Usage
Visualize and compare two data series across multiple years to highlight market trends and competitive positioning. The dual-line structure enables clear communication of relative performance, growth trajectories, and strategic insights. Essential for quarterly reviews, annual reports, investor presentations, and strategic planning sessions where trend analysis drives decision-making.
-
How to Use
Two intersecting lines on a dark blue grid background display data points for each year from 2021 to 2030. Present one series at a time for focused analysis, or display both simultaneously for comparative insights. Fully editable: modify colors, data values, and labels to match your specific metrics and corporate branding in minutes.
-
Recommended For
Executive teams, business analysts, and marketing professionals presenting quarterly or annual performance reviews. Ideal for investor relations (IR) decks, business plans, competitive analysis reports, and market research presentations. Suitable for financial analysis, sales performance tracking, customer satisfaction trends, and any dual-metric comparison requiring professional visualization.
-
Slide Structure
2-slide template in 16:9 widescreen format (PPTX). Slide 1: Title area + dark blue background with dual-series line chart (10 data points spanning 2021–2030, light blue and white lines, numeric labels, legend, and descriptive text). Slide 2: Identical layout with dark burgundy background for color variation and visual flexibility.
Related Products
-

Competitor Comparison Graph & Table - Essential Tool for Market Analysis
#Market and Competitor Analysis #Diagram #Competitor Analysis
-

Dawn City Theme Competitor Analysis Graph – Understanding Market Trends
#Market and Competitor Analysis #Diagram #Graph
-

Competitor Analysis Graph & Table by Year
#Market and Competitor Analysis #Diagram #Graph
-

Visualizing Market Analysis with Line Chart – Harmony of Mint and Orange
#Market and Competitor Analysis #Diagram #Graph
