Development Status Analysis Pie Type 3D Graph
RJ0400055_10
- Last Update 06/01/2025
- File Size 14.7MB
- # of Slides 2
- File Format PPTX
- Slide Ratio 16:9
- Color
Keywords
- #Content-Based Slides
- #Design-Based Slides
- #Product/Service Introduction
- #Market and Competitor Analysis
- #Graph
- #Development Status
- #Market Share
- #Circles
- #Pie Chart
- #16:9
- #pie chart PowerPoint slide
- #3D graph presentation
- #development status template
- #data visualization chart
- #ratio comparison slide
About the Product
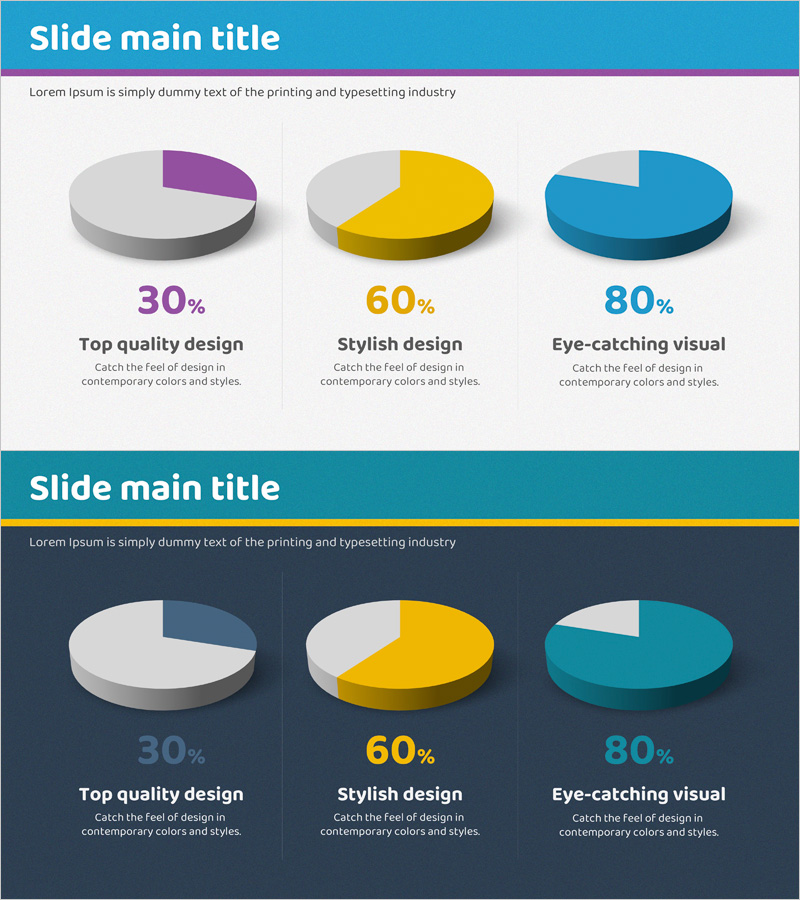
A professional 3D pie chart PowerPoint slide set designed for visualizing development project progress and status analysis. This template includes 2 layout variations featuring both light and dark background options to suit different presentation environments. The three data segments are represented in purple, yellow, and blue colors for clear visual distinction and intuitive ratio comparison. Ideal for expressing market share, development phase completion rates, resource allocation, and other business metrics in executive presentations and project status reports.
Usage Points
-
Main Usage
Effectively visualizes the proportional relationships between three key metrics such as project completion rates, market share distribution, or resource allocation using 3D pie chart design. Perfect for executive briefings, investor presentations, and project status updates requiring clear quantitative data representation.
-
How to Use
Customize the pie segment colors and percentage values to match your project data. The light background layout works best in bright presentation venues, while the dark background is optimized for projection in dimly lit environments. Add descriptive text and legends to enhance audience comprehension and engagement.
-
Recommended For
Development team leads, project managers, executive report presenters, marketing analysts, investor relations specialists, and business intelligence professionals who need to communicate quantitative data effectively to stakeholders.
-
Slide Structure
Consists of 2 slides with identical 3-segment 3D pie chart layouts on contrasting backgrounds—light gray and navy tones respectively. Each slide features three pie segments (purple 30%, yellow 60%, blue 80%) with corresponding labels and descriptive text areas for customization.
Related Products
-

Brand Awareness Distribution Chart – Market Share Analysis
#Product/Service Introduction #Market and Competitor Analysis #Graph
-

Purchase Volume Comparison Analysis Circle Graph – Understanding Market Share
#Product/Service Introduction #Market and Competitor Analysis #Graph
-

Market Share Analysis Graph & Table – Enhancing Understanding through Data Visualization
#Product/Service Introduction #Market and Competitor Analysis #Diagram
-

Pie Chart for Learning Progress – Optimizing Data Visualization
#Product/Service Introduction #Market and Competitor Analysis #Graph
