Key Financial Indicators for Camera Shooting App - Visual Table Presentation
RJ0400054_24
- Last Update 06/01/2025
- File Size 4.9MB
- # of Slides 2
- File Format PPTX
- Slide Ratio 16:9
- Color
Keywords
- #Content-Based Slides
- #Design-Based Slides
- #Financial Plans and Performance
- #Diagram
- #Other
- #Key Financial Indicators
- #Table
- #16:9
- #financial metrics PowerPoint slide
- #financial data table presentation
- #4-column financial table slide
- #investor pitch financial PPT
- #how to present financial metrics in PowerPoint
About the Product
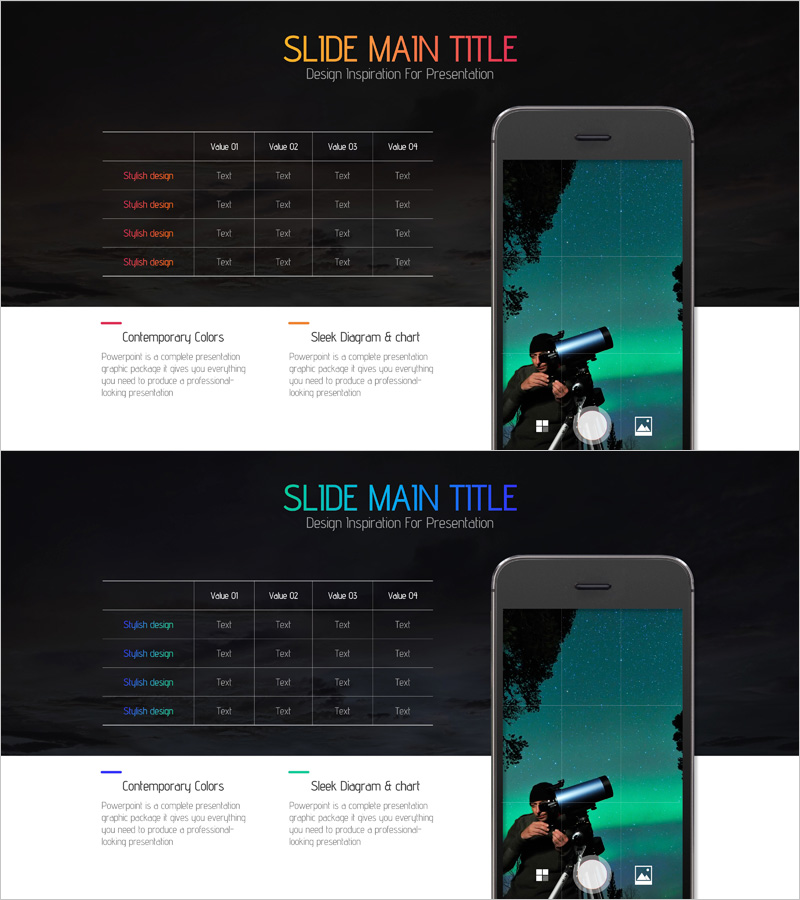
A visual table presentation of key financial indicators for a camera shooting app, designed as a PowerPoint slide with dark background and teal, orange, and purple accent lines. The 4-column data table layout enables quick comparison of financial metrics and performance indicators. This 2-slide PPTX template is ready for investor presentations, IR materials, and business reports. Clear text input areas allow flexible entry of various financial data such as revenue, profit margin, growth rate, and customer acquisition cost.
Usage Points
-
Main Usage
Present startup and app company financial performance clearly to investors and partners. The slide organizes key metrics—revenue, profit margin, growth rate, customer acquisition cost—into four comparable columns. The dark background with accent colors reinforces corporate credibility and professionalism.
-
How to Use
Enter actual financial figures into the text input areas and adjust accent line colors as needed. Use in IR materials' financial section, business report performance analysis pages, or investment pitch presentations. The 2-slide format allows sequential comparison of financial metrics across multiple quarters or years.
-
Recommended For
Startup founders, finance managers, investor relations (IR) professionals, business development managers, and consultants who need to support decision-making with financial data. Particularly suited for tech companies in app development, software, and fintech seeking investment.
-
Slide Structure
Each slide features a title area at the top, a central 4-column data table (Value 01–04 headers with 4 rows of Stylish design items), and a description section at the bottom (Contemporary Colors and Sleek Diagram & chart text). A mobile app image on the right side reinforces the product context visually.
Related Products
-

Triangular Pattern Presentation Template Pie Chart – Market Analysis and Strategy
#Market and Competitor Analysis #Financial Plans and Performance #Diagram
-

Running Face Measurement Table – Visualizing Fitness Data
#Product/Service Introduction #Financial Plans and Performance #Diagram
-

Sales and Profit Analysis Table – Essential Tool for Presentation
#Financial Plans and Performance #Diagram #Other
-

Application Development Business Balance Sheet – Stylish Financial Presentation
#Financial Plans and Performance #Diagram #Other
