SNS Usage Status Comparison Graph – Market Analysis and Competitive Advantage
RJ0400054_23
- Last Update 06/01/2025
- File Size 0.1MB
- # of Slides 2
- File Format PPTX
- Slide Ratio 16:9
- Color
Keywords
About the Product
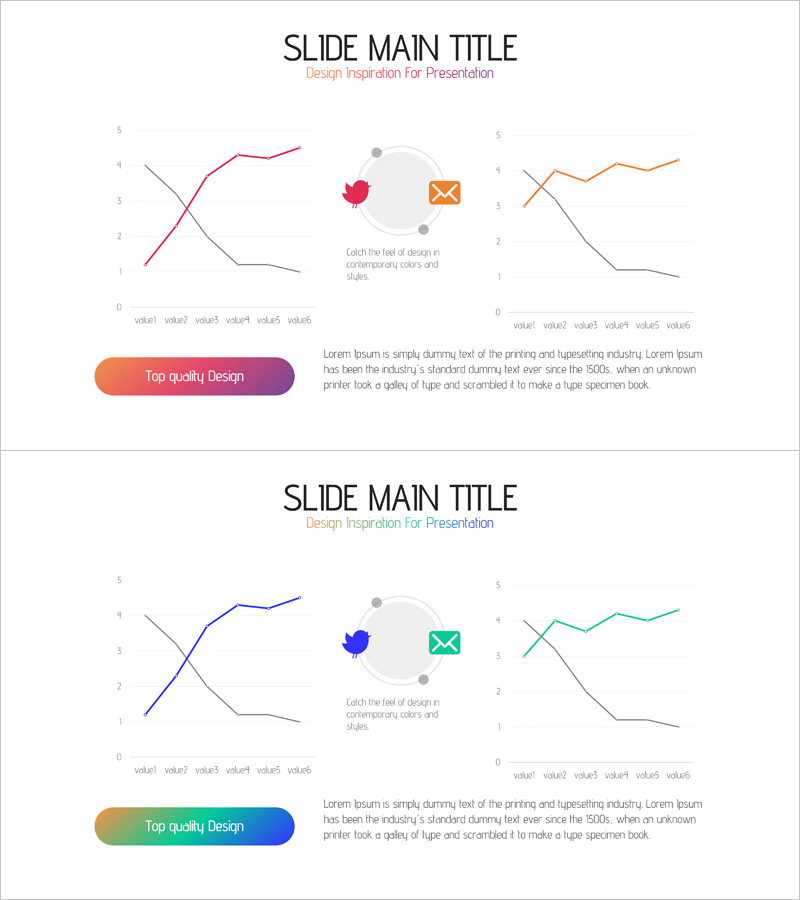
A PowerPoint slide designed to visually compare SNS usage trends and market performance. Features a pink line chart on the left and an orange line chart on the right, enabling side-by-side data comparison. The center area includes icons and descriptive text to highlight key insights. This 16:9 widescreen, 2-slide PPTX template is ready for immediate use in market analysis presentations, competitive benchmarking, and SNS marketing strategy reports. Fully editable format allows you to customize data values, labels, and messaging to match your specific analysis.
Usage Points
-
Main Usage
Visualize SNS platform usage trends, user growth patterns, and competitive performance through dual line charts. Clearly communicate market insights and competitive positioning to stakeholders, investors, and internal teams during strategy presentations and business reviews.
-
How to Use
On slide 1, input your comparison data into the two line charts and add your key message in the center icon area. Use slide 2 for additional analysis or supporting insights. Customize colors and numerical values to reflect your actual SNS metrics or competitive benchmark data.
-
Recommended For
Marketing managers, business strategists, executives preparing performance reports, SNS platform analysts, and market research professionals who need to present competitive data and usage trends with visual clarity and impact.
-
Slide Structure
Slide 1: Title area + left line chart (pink) + right line chart (orange) + center icon and text description area. Slide 2: Identical layout for additional data or analysis content. Two-part comparative structure supports side-by-side data visualization and insight communication.
Related Products
-

Gradient Theme Broken Line Graph – Market Analysis and Competitive Edge
#Market and Competitor Analysis #Graph #Competitor Analysis
-

Analyzing 2 Comparison Graphs - Slides for Deriving Competitive Advantage
#Market and Competitor Analysis #Graph #Competitor Analysis
-

Market Insights Through Competition Analysis Chart – Gaining Competitive Edge
#Market and Competitor Analysis #Graph #Competitor Analysis
-

Gradient Vertical Bar Chart – Suitable for Market and Competitive Analysis
#Market and Competitor Analysis #Graph #Competitor Analysis
