Cement Theme Area Graph – Data Visualization Emphasizing Competitive Advantage
RJ0300058_19
- Last Update 05/03/2025
- File Size 3MB
- # of Slides 2
- File Format PPTX
- Slide Ratio 16:9
- Color
Keywords
About the Product
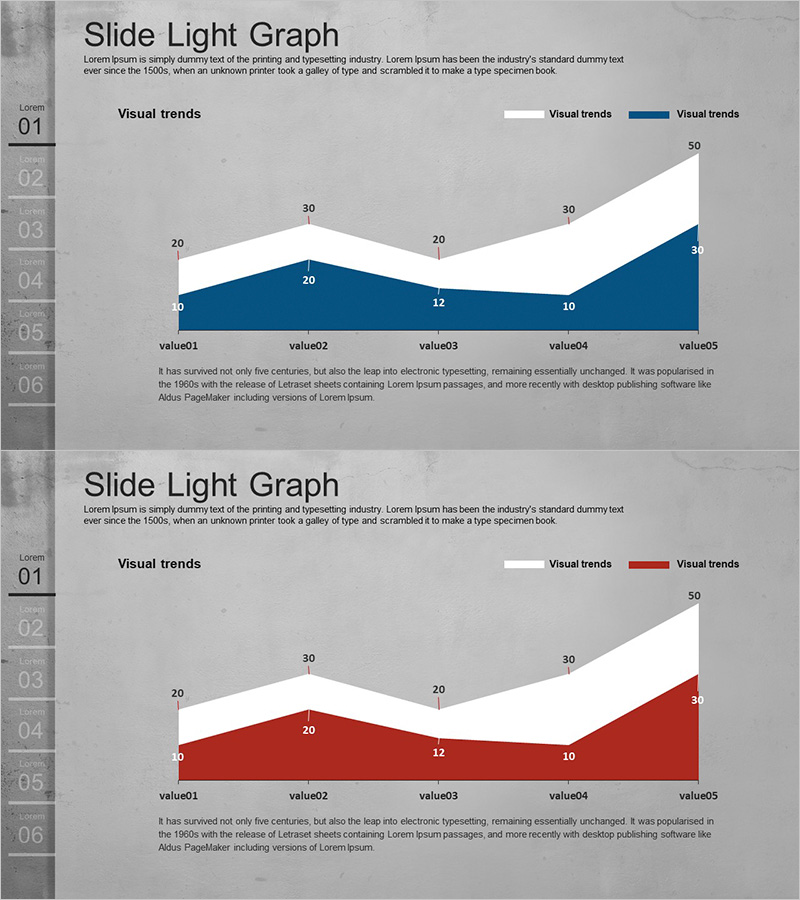
Area chart PowerPoint slide featuring a cement-tone gray background with blue and white filled areas representing two data series. This presentation slide visualizes five data points to show trend changes and comparative analysis between two metrics simultaneously through overlapping areas. Left-side numbering (01–06) indicates slide sequence, with detailed description text areas positioned below each chart. The design is ready for immediate use in business reports, competitive analysis, market share tracking, and performance trend comparisons.
Usage Points
-
Main Usage
Displays two or more data series using overlapping filled areas to communicate both trend changes over time and comparative relationships between series. Optimized for data visualization where cumulative effect and series comparison are critical, such as competitive analysis, market share evolution, and performance tracking.
-
How to Use
Insert into market analysis sections of reports, competitive advantage pages of business plans, or performance trend slides in investor pitch decks. Edit area colors and data values to match your metrics for immediate deployment in presentations.
-
Recommended For
Marketing professionals, business strategists, financial analysts, and consultants who need to visualize quantitative data to support decision-making. Particularly effective for presentations requiring competitive analysis and performance benchmarking.
-
Slide Structure
2-slide set. Each slide contains a title area, legend for two data series, area chart with five labeled data points, and descriptive text section at the bottom. Gray background with blue and white area fills distinguish series; linear trend lines emphasize directional change across the five data points.
Related Products
-

Monthly Volume Overview Area Chart – Essential Tool for Market Analysis
#Market and Competitor Analysis #Graph #Competitor Analysis
-

Third Party Comparison Pentagon Area Graph – Competitive Advantage Analysis
#Market and Competitor Analysis #Graph #Competitor Analysis
-

Goal Achievement Analysis Area Graph – Data-driven Competitive Edge
#Market and Competitor Analysis #Graph #Other
-

A vs B Diagram for Competitive Advantage Analysis
#Market and Competitor Analysis #Other #Competitor Analysis
