Gradient Theme Broken Line Graph – Market Analysis and Competitive Edge
RJ0300060_23
- Last Update 05/04/2025
- File Size 0.8MB
- # of Slides 2
- File Format PPTX
- Slide Ratio 16:9
- Color
Keywords
- #Content-Based Slides
- #Design-Based Slides
- #Market and Competitor Analysis
- #Graph
- #Competitor Analysis
- #Competitive Advantage
- #Line
- #Line Chart
- #16:9
- #line chart PowerPoint slide
- #market analysis presentation template
- #dual-series chart
- #competitive analysis graph
- #data trend visualization
- #business chart template
- #how to create line chart in PowerPoint
About the Product
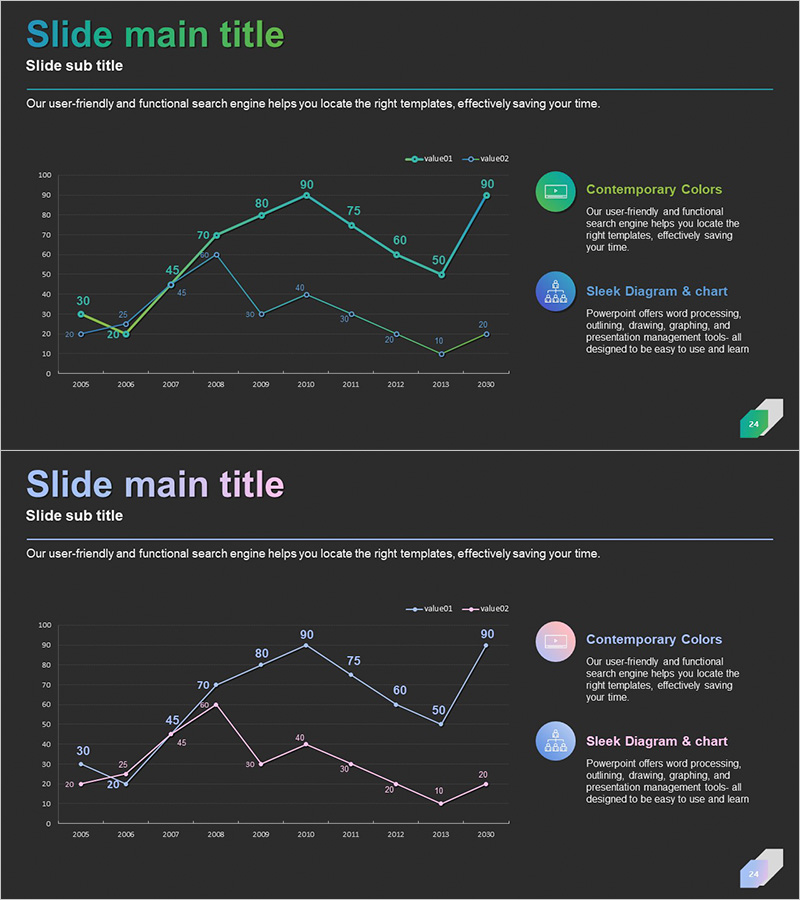
A dual-series line chart PowerPoint slide optimized for market analysis and competitive positioning. This presentation template visualizes data trends from 2006 to 2020, using cyan and purple gradient color schemes to clearly distinguish two performance metrics. The dark background with bright accent lines creates strong contrast, making numerical changes intuitive and visually compelling during presentations. With labeled data points and a clear legend, the slide is ready to edit and adapt. Perfect for marketing reports, business analysis presentations, executive dashboards, competitive intelligence briefings, and strategic planning sessions.
Usage Points
-
Main Usage
Displays two data series over time to compare market trends, competitive metrics, revenue growth, or performance indicators. Ideal for executive reports, marketing strategy presentations, business performance analysis, and investor briefings where showing parallel trends and divergence patterns is critical.
-
How to Use
The slide features a dark background with cyan and purple lines intersecting to mark data points. A legend distinguishes the two series, and year-by-year value labels are visible for easy reference during presentations. Simply replace the data values and series names with your own metrics to customize the chart for your specific analysis.
-
Recommended For
Marketing managers, financial analysts, executives, business development teams, consultants, and data analysts presenting market dynamics, competitive benchmarking, financial performance, customer satisfaction trends, or operational metrics. Suitable for quarterly reports, investor presentations, strategy meetings, and board-level communications.
-
Slide Structure
Two-slide set in 16:9 widescreen format (PPTX). First slide displays a cyan-purple dual-series line chart spanning 2006–2020, with descriptive text and icons on the right side highlighting contemporary colors and sleek diagram features. Second slide presents a similar layout with pink and blue gradient series. Both slides include gridlines, data labels, and legend for clarity.
Related Products
-

Competition Graphs and Analysis – Slides for Market Advantage
#Market and Competitor Analysis #Graph #Competitor Analysis
-

Variation Graph for the Line Chart – Optimized Design for Market and Competitor Analysis
#Market and Competitor Analysis #Graph #Competitor Analysis
-

Neon Tone Competitor Analysis Broken Line Graph
#Market and Competitor Analysis #Graph #Competitor Analysis
-

Competitor Comparison Analysis Graph - Highlighting Competitive Advantage
#Market and Competitor Analysis #Graph #Competitor Analysis
