Area 3D Graph – Market and Competitor Analysis
RJ0400054_22
- Last Update 06/01/2025
- File Size 0.3MB
- # of Slides 2
- File Format PPTX
- Slide Ratio 16:9
- Color
Keywords
About the Product
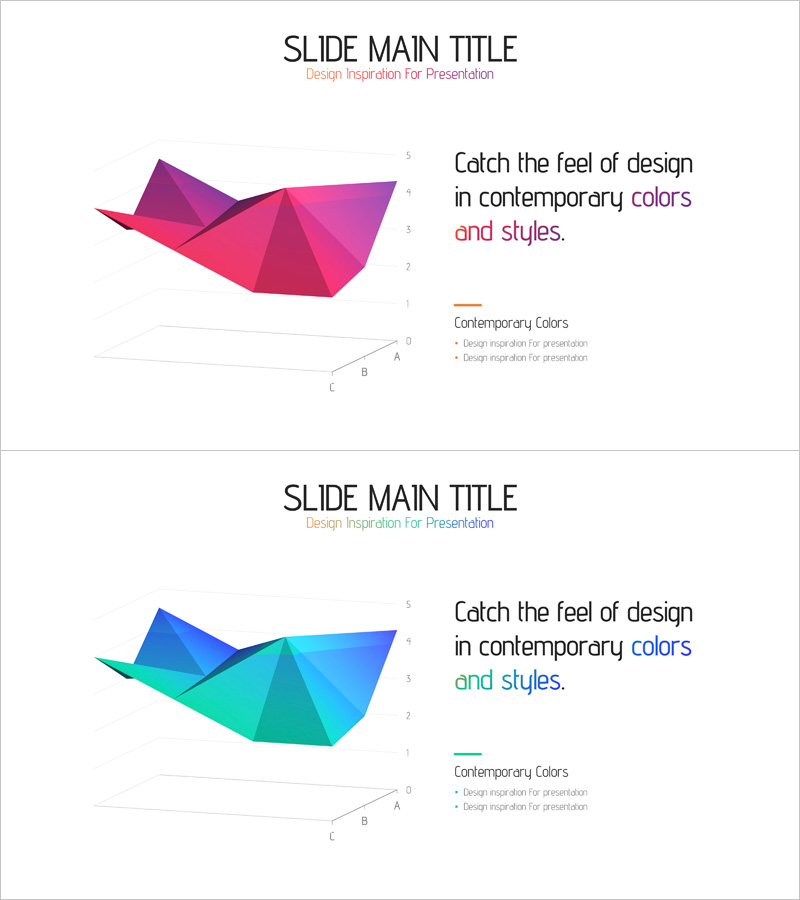
A PowerPoint slide featuring 3D area graphs designed to compare market conditions and competitor analysis side by side. This presentation template includes two color theme variations: pink-purple tones and blue-cyan tones, providing visual flexibility for different contexts. The right side offers a text area for key insights, while the left side displays a 3D area graph capable of visualizing multiple data layers simultaneously—ideal for representing market share, competitive intensity, growth rates, and other complex metrics. The 2-slide deck is formatted in 16:9 widescreen PPTX, ready for immediate editing and customization in your presentations, reports, and slide decks.
Usage Points
-
Main Usage
Visualize market conditions and competitive positioning using 3D area graphs to support data-driven decision-making. Present multiple metrics (market size, share, growth rate, competitive intensity) simultaneously, enhancing audience comprehension and strengthening presentation persuasiveness.
-
How to Use
Use in the market analysis section of business plans, investor pitch decks, or marketing strategy presentations to explain current market landscape and competitive positioning. Input actual data into the left graph and add key insights to the right text area to create a complete analytical slide.
-
Recommended For
Recommended for strategy managers, marketing professionals, and business development teams presenting to executives, investors, or partners. Ideal for presentations emphasizing competitive analysis and market opportunity identification.
-
Slide Structure
Slide 1: Pink-purple 3D area graph with right-side text area (title, description, 3 bullet points). Slide 2: Blue-cyan identical layout for comparative analysis. Each slide is divided into left graph section and right text section, enabling parallel presentation of data and interpretation.
Related Products
-

Spaceship Launch Analysis Graph – Ideal for Competitor Analysis
#Market and Competitor Analysis #Diagram #Graph
-

Social Network Market Analysis Bar Chart – Trends Insight
#Product/Service Introduction #Market and Competitor Analysis #Graph
-

Idea Analysis Graph – Market Analysis Visualization
#Market and Competitor Analysis #Graph #Other
-

Regional Demand Survey Graph – Key to Market Analysis
#Market and Competitor Analysis #Financial Plans and Performance #Graph
