VR Analysis Vertical Bar Graph – Boosting Market Competitiveness
RJ0400050_12
- Last Update 05/30/2025
- File Size 0.4MB
- # of Slides 2
- File Format PPTX
- Slide Ratio 16:9
- Color
Keywords
About the Product
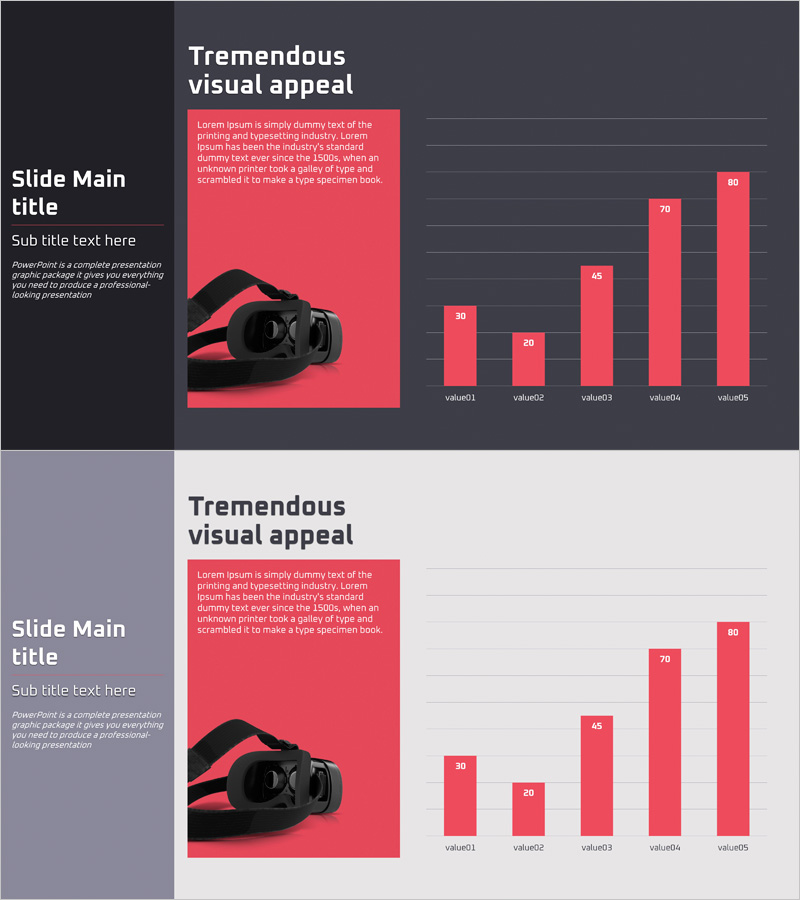
A vertical bar chart PowerPoint slide designed for VR technology market analysis and competitive benchmarking. The slide features five coral-pink bars representing value01 through value05, set against a dark background with contrasting light text boxes to maximize information clarity. The left side displays a VR device image with a descriptive text area, allowing simultaneous product introduction and data visualization. Formatted in 16:9 widescreen with 2 slides in editable PPTX format. Ideal for technology analysis, market research, and competitive advantage presentations.
Usage Points
-
Main Usage
Visualizes VR technology market competitiveness and numerical comparisons with precision. The vertical bar chart enables clear comparison of five performance metrics, market share, or technology levels, while the left-side image area accommodates product descriptions for integrated analytical presentations.
-
How to Use
Use in technology planning, marketing, and executive briefing materials to demonstrate VR product market positioning and competitive advantages. Customize bar heights and values with your data, and populate the left text box with product features or market analysis content. Two background versions (dark and light) allow flexible adaptation to presentation themes.
-
Recommended For
Recommended for VR/AR technology companies' investor pitches, product launch announcements, market analysis reports, and technology competitiveness strategy presentations. Particularly effective for executives, technical teams, and marketing professionals explaining competitive advantages. Also suitable for academic presentations and industry analysis seminars.
-
Slide Structure
Two-slide layout: first slide features a dark charcoal background with coral-pink vertical bars; second slide uses a light lavender background with identical chart structure. Both slides position a VR device image and text box (title and description area) on the left, with a five-bar graph labeled value01–value05 on the right.
Related Products
-

Spade Shape Graph – Market and Competitor Analysis
#Market and Competitor Analysis #Graph #Competitor Analysis
-

Competitor and Market Analysis Slide Design - Harmony of Blue and Yellow
#Market and Competitor Analysis #Diagram #Graph
-

Vertical Bar Standard Color Chart for Market Analysis – Market and Competitor Analysis
#Market and Competitor Analysis #Graph #Competitor Analysis
-

Big Data Analysis Template Intro
#Market and Competitor Analysis #Graph #Competitor Analysis
