Vertical Bar Graph & Folder Diagram – Market and Competitor Analysis
RJ0300046_13
- Last Update 04/30/2025
- File Size 3.4MB
- # of Slides 2
- File Format PPTX
- Slide Ratio 16:9
- Color
Keywords
- #Content-Based Slides
- #Design-Based Slides
- #Market and Competitor Analysis
- #Diagram
- #Graph
- #Competitor Analysis
- #Market Analysis
- #Cluster
- #Column
- #Closed Cluster Diagram
- #Column Chart
- #16:9
- #vertical bar chart PowerPoint
- #folder diagram template
- #market analysis slide
- #competitive analysis presentation
- #data visualization PPT
- #business analysis slide template
About the Product
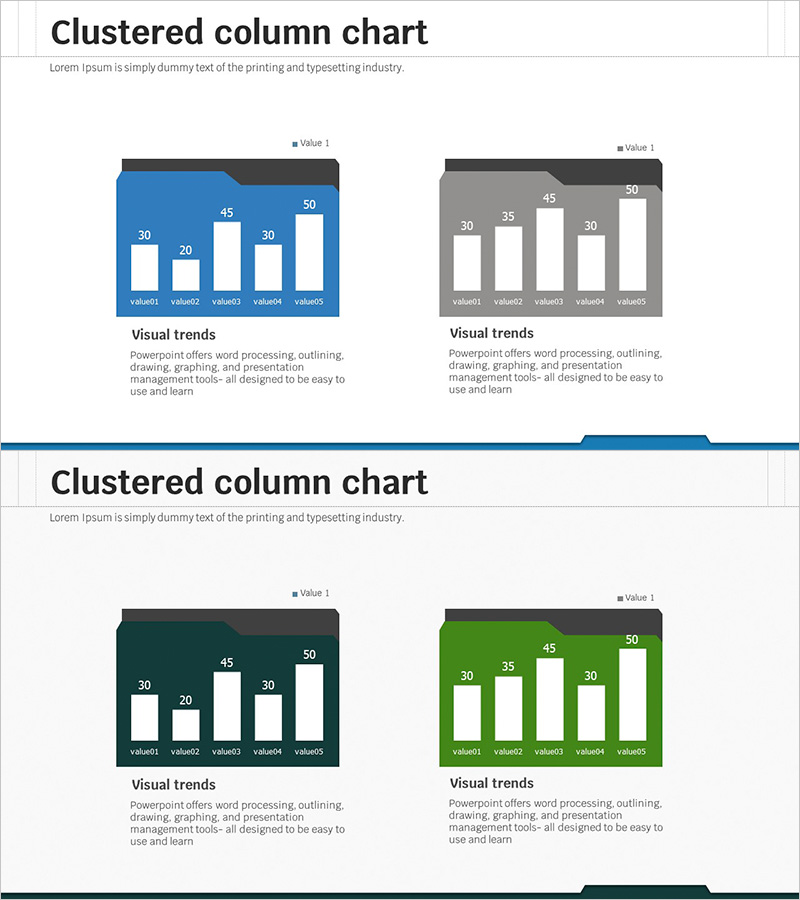
A dual-purpose data visualization slide set for market analysis and competitive landscape assessment. The first slide features a vertical bar chart comparing five data points with clear value labels, fully editable in PowerPoint. The second slide uses a folder diagram to represent information hierarchy, ideal for organizational structures or category classifications. Four color versions are included—blue, gray, dark green, and lime green—allowing you to match your presentation's visual tone. Both slides are designed in 16:9 widescreen format and effectively emphasize data-driven decision-making in business presentations, reports, and strategic planning documents.
Usage Points
-
Main Usage
Simultaneously present quantitative data comparisons and information hierarchy structures in analytical materials. Ideal for visualizing market size, competitor performance, departmental results, and other metrics that support data-driven business decisions, while the folder diagram clarifies analytical categories or organizational frameworks.
-
How to Use
Input actual data into the vertical bar chart to visualize comparative analysis results, and add category labels to the folder diagram to represent information classification systems. Use PowerPoint's native shape editing tools to adjust node count and colors. Select the color version that best matches your overall presentation tone from the four available options.
-
Recommended For
Market analysis presentations from marketing, sales, and strategy teams; competitive landscape sections in executive reports; market size and market share comparisons in business plans; data-driven analysis materials in consulting proposals. Suitable for any business presentation requiring quantitative evidence and structured information display.
-
Slide Structure
Slide 1: Vertical bar chart with 5 data items (value01–value05), legend, and data labels clearly displayed. Slide 2: Folder diagram representing 3–4 levels of information hierarchy. All four color versions (blue, gray, dark green, lime green) maintain consistent color palettes throughout.
Related Products
-

Experimental Results Analysis Vertical Bar Graph – Incorporating Visual Trends
#Market and Competitor Analysis #Diagram #Graph
-

Gradient Thermometer Shape Graph – Market and Competitor Analysis
#Market and Competitor Analysis #Graph #Competitor Analysis
-

Comparative Analysis Vertical Bar Graph – Gaining Competitive Advantage through Market Analysis
#Market and Competitor Analysis #Graph #Competitor Analysis
-

Competitor Analysis Broken Line Graph – Visualizing Market Trends
#Market and Competitor Analysis #Diagram #Graph
