Cluster Diagram Slide for Stepwise Operations Planning
RJ0400053_21
- Last Update 06/01/2025
- File Size 0.1MB
- # of Slides 2
- File Format PPTX
- Slide Ratio 16:9
- Color
Keywords
- #Content-Based Slides
- #Design-Based Slides
- #Business Strategy
- #Operational Plan
- #Diagram
- #Step-by-Step Schedule Plan
- #Project Implementation Schedule
- #Cluster
- #Closed Cluster Diagram
- #16:9
- #cluster diagram PowerPoint
- #arrow diagram slide
- #3-step process diagram
- #operations planning slide
- #stepwise process PowerPoint template
About the Product
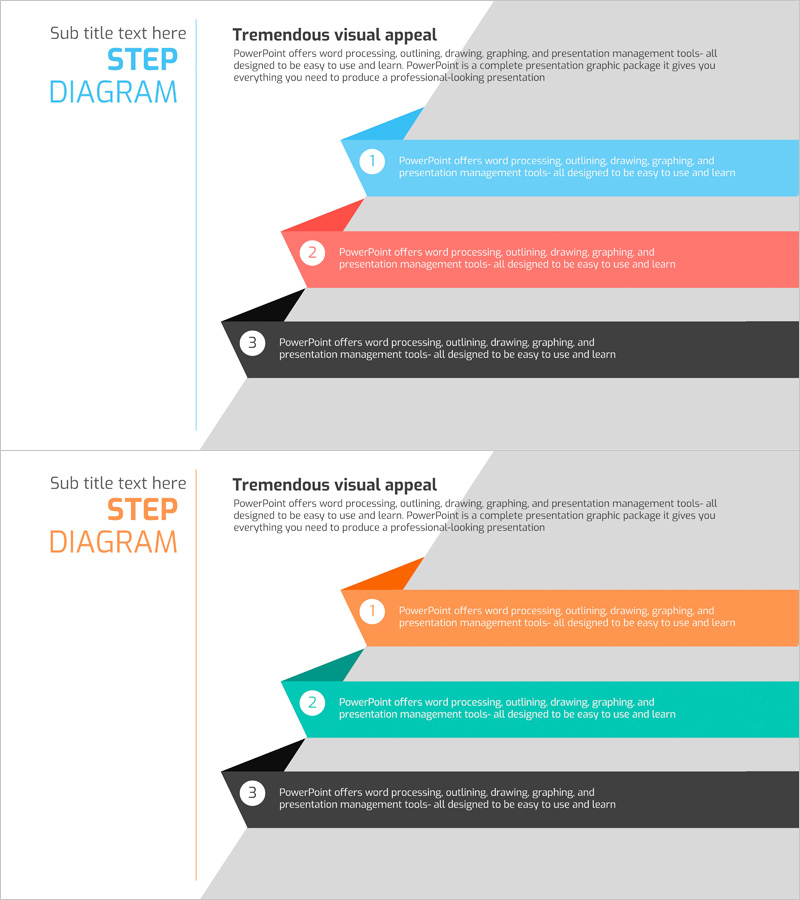
A 3-step arrow cluster diagram PowerPoint slide designed to visualize stepwise operations planning and business strategy execution. Three colored arrows—blue, red, and black—point rightward from a vertical axis on the left, each with a circular numbered badge and text area. Optimized for 16:9 widescreen format in a 2-slide set, this diagram clearly communicates program introduction, operational planning, and business implementation phases. Each arrow is independently editable, allowing you to customize colors and text instantly for diverse presentation contexts. Ideal for business proposals, strategy reports, and project management briefings.
Usage Points
-
Main Usage
Optimized for visualizing stepwise processes in operations planning, business strategy execution, and program introduction. Colored arrows emphasize sequence and flow, while circular numbered badges clarify stage differentiation. Ample text areas allow detailed description of each phase's content and objectives.
-
How to Use
Select each arrow shape and text box to input your content. To change colors, right-click the arrow and choose shape fill options from the context menu. Number badges and text are independently editable. To adjust the number of steps, duplicate arrows and arrange them as needed.
-
Recommended For
Ideal for executives, project managers, marketing professionals, and strategy planning teams presenting business implementation phases, operational processes, and program roadmaps. Applicable to investor pitches, business plans, strategy reports, organizational restructuring announcements, and other corporate presentations.
-
Slide Structure
2-slide set with each slide divided into a left vertical axis and right arrow area. Slide 1 features three arrows in blue, red, and black; Slide 2 offers orange, teal, and black arrows for color variation. Each arrow includes a circular numbered badge (1, 2, 3) and text input area for flexible customization.
Related Products
-

Trade Schedule and Stages – Step-by-Step Approach
#Business Strategy #Business Management #Diagram
-

4-Step Action Plan for Strategy Execution
#Business Strategy #Customer Success Stories #Diagram
-

Weather Status Analysis Graph
#Business Strategy #Market and Competitor Analysis #Diagram
-

Project Order Information – Guidance through Visual Flow
#Product/Service Introduction #Business Strategy #Diagram
