Trade Schedule and Stages – Step-by-Step Approach
RB0100045_9
- Last Update 03/06/2025
- File Size 0.4MB
- # of Slides 2
- File Format PPTX
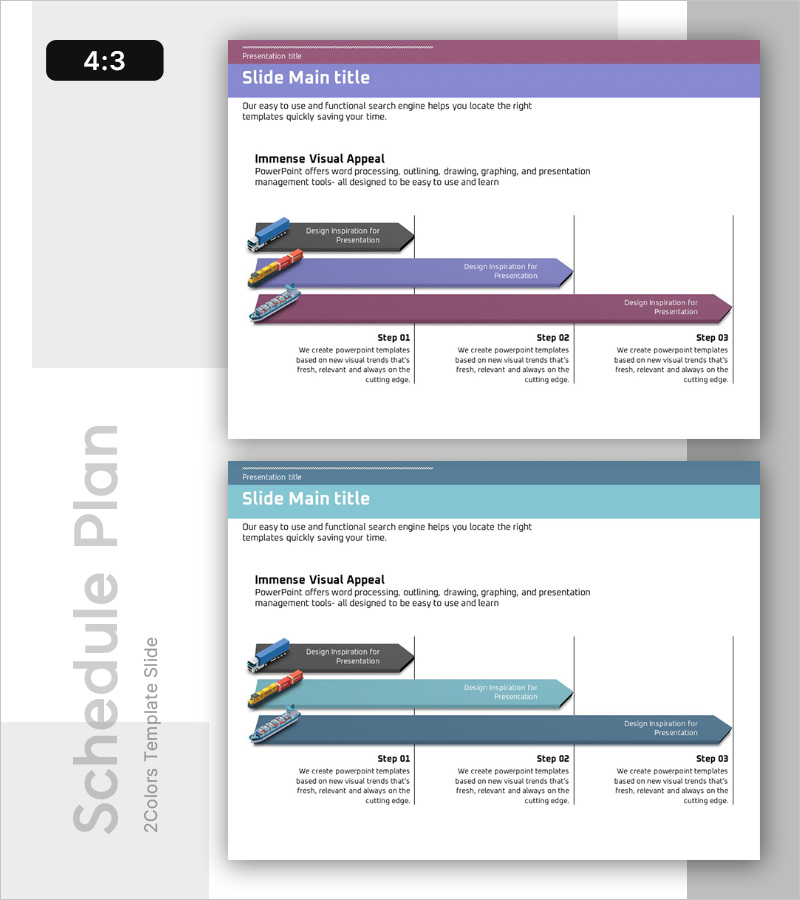
- Slide Ratio 4:3
- Color
Keywords
- #Content-Based Slides
- #Design-Based Slides
- #Business Strategy
- #Business Management
- #Diagram
- #Step-by-Step Schedule Plan
- #Implementation Schedule
- #Flow
- #Cluster
- #Linear Flow
- #Closed Cluster Diagram
- #4:3
- #arrow diagram PowerPoint
- #3-step process slide
- #trade schedule presentation
- #phased strategy PPT
- #process flow diagram slide
About the Product
A 3-step arrow diagram PowerPoint slide designed to visualize trade schedules and phased business strategies. The slide features gradient-filled arrows in blue, orange, and purple that represent sequential processes, with detailed description text areas positioned below each step. This 4:3 ratio, 2-slide template is ready to use for business presentations, project timelines, marketing campaign phases, and strategic planning decks.
Usage Points
-
Main Usage
Ideal for presenting trade schedules, business strategies, and project phases in a sequential, easy-to-follow format. The three arrow shapes represent linear progression, while dedicated text areas below each arrow allow for detailed stage descriptions that enhance audience comprehension.
-
How to Use
Edit the text within each arrow shape to add stage names, then fill in the text boxes below with detailed content for each phase. You can maintain the existing gradient color scheme or customize the arrows to match your company's brand colors. Duplicate the 2-slide template to add additional process steps as needed.
-
Recommended For
Trade professionals, business planners, project managers, and marketing teams presenting schedules, phased strategies, and campaign roadmaps. Perfect for executive briefings, team meetings, and client presentations where complex processes need to be communicated clearly and concisely.
-
Slide Structure
Three left-pointing arrow shapes arranged vertically, each filled with gradient colors: blue, orange, and purple. Stage names appear within the arrows, while three separate text boxes below provide space for detailed explanations of each phase.
Related Products
-

Sequential Arrow Diagram – Visualizing Business Strategy
#Business Strategy #Business Management #Diagram
-

Basic Physical Exercise Sequence – Simple Step-by-Step Activities
#Business Strategy #Business Management #Diagram
-

Companion Flow Diagram – Visualizing Business Strategy
#Business Strategy #Diagram #Step-by-Step Schedule Plan
-

Step-by-step Quality Assurance Plan Diagram
#Business Strategy #Business Management #Diagram
