Big Data Analysis Vertical Bar Graph – Effective Market Analysis
RJ0400053_15
- Last Update 06/01/2025
- File Size 1.3MB
- # of Slides 2
- File Format PPTX
- Slide Ratio 16:9
- Color
Keywords
- #Content-Based Slides
- #Design-Based Slides
- #Product/Service Introduction
- #Market and Competitor Analysis
- #Graph
- #Program Introduction
- #Market Analysis
- #Column
- #Grouped Column
- #16:9
- #vertical bar chart PowerPoint
- #grouped column chart template
- #year-over-year comparison slide
- #big data analysis chart
- #market analysis graph PowerPoint
About the Product
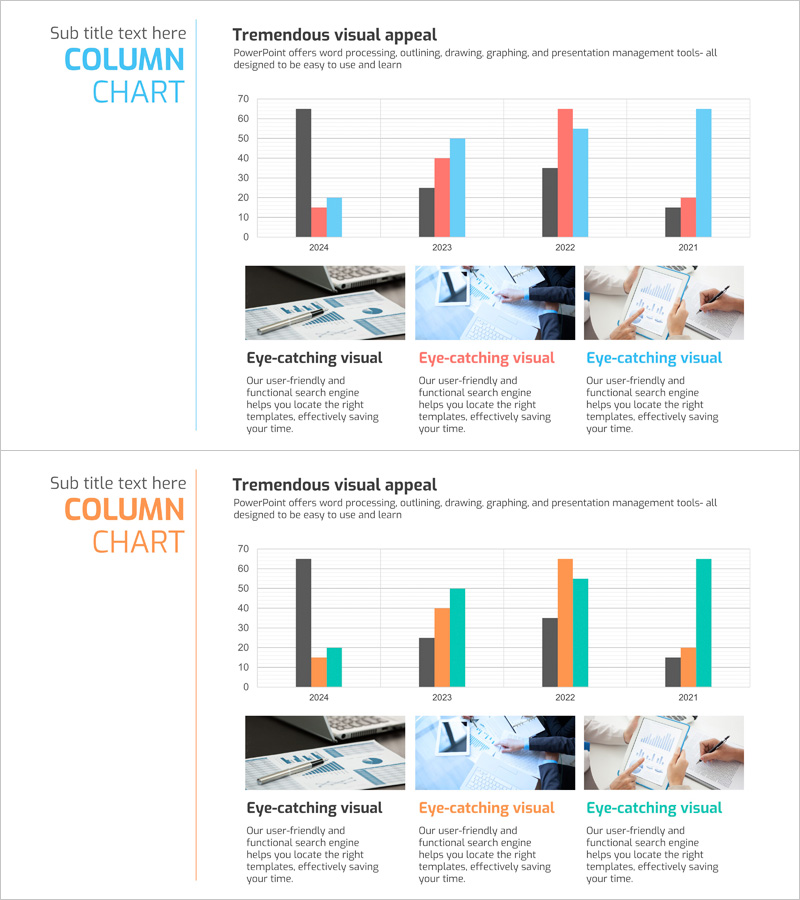
A vertical bar chart PowerPoint slide optimized for big data analysis and market research presentations. This slide template displays multi-year data comparison from 2024 to 2021 across four data series in a grouped column format. The design uses distinct color coding—black, red, and blue—to differentiate each series, with gridlines for easy value reading. Ideal for visualizing business metrics such as competitive analysis, revenue trends, market share, and customer satisfaction in executive presentations and analytical reports.
Usage Points
-
Main Usage
Compares numerical data across four series simultaneously by year, department, or product category. Enables visualization of multiple business metrics—revenue, customer count, market share, satisfaction scores—on a single slide to communicate trends and relative performance intuitively.
-
How to Use
Read data values by comparing bar heights and colors across the grouped columns. Reference the X-axis (years) and Y-axis (values) to interpret the data. Edit the slide directly in PowerPoint to input your own data or modify colors to match your presentation theme.
-
Recommended For
Suitable for financial reports, business plans, marketing proposals, quarterly performance reviews, executive briefings, and market research presentations. Recommended for executives, data analysts, marketing professionals, and consultants who need data-driven decision-making visuals.
-
Slide Structure
Two-slide set. First slide features a blue title area with a grouped vertical bar chart displaying 4 years (2024–2021) with 3–4 data points per year across four series. Second slide uses an orange title area with identical chart structure, allowing flexible data representation for different datasets.
Related Products
-

Competitor Comparison Analysis Graph - A Tool for Effective Market Analysis
#Market and Competitor Analysis #Diagram #Graph
-

Clustered Vertical Bar Graph for Market Analysis – Data Insights
#Market and Competitor Analysis #Graph #Competitor Analysis
-

Laptop Mockup Bar Graph – Essential Slide for Competitor Analysis
#Market and Competitor Analysis #Graph #Other
-

Visual Comparison by Product Group Slide Template – Market Trends and Performance
#Market and Competitor Analysis #Financial Plans and Performance #Graph
