PC Game Sales and Revenue Table – Visualizing Financial Performance
RJ0400052_20
- Last Update 05/31/2025
- File Size 10.1MB
- # of Slides 2
- File Format PPTX
- Slide Ratio 16:9
- Color
Keywords
About the Product
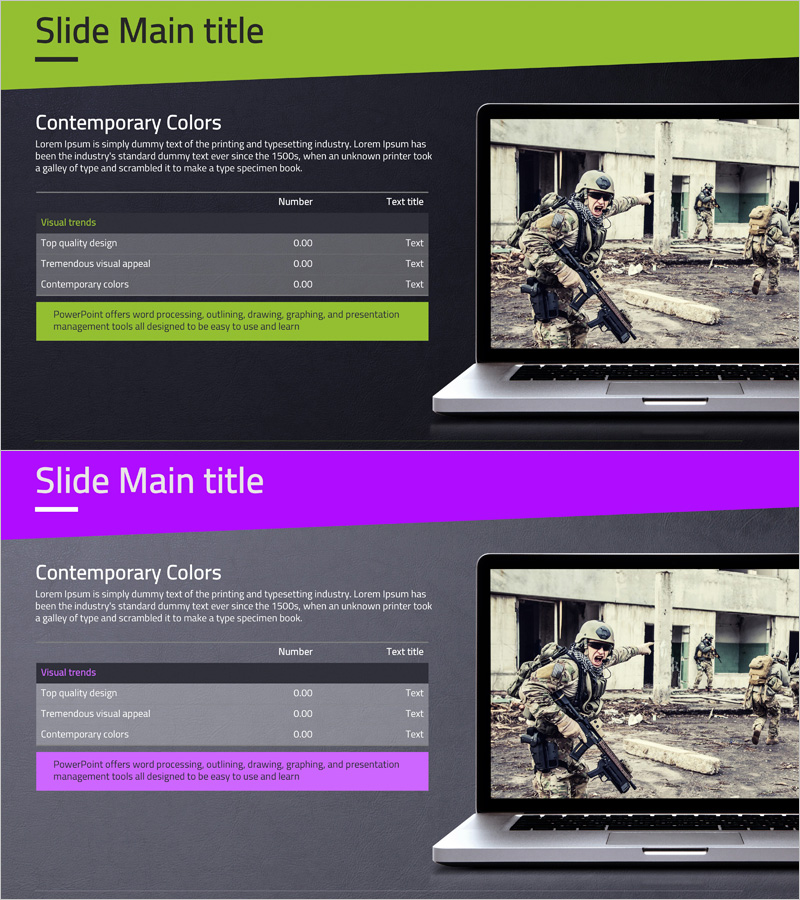
This slide features a profit and loss table designed to intuitively convey the sales and revenue of PC games. With a bold black and gray background, it enhances the professional image and visual impact while clearly representing sales flow and revenue structure. It is particularly suitable for business investment analysis, industry reports, and profitability assessments. The editing difficulty is rated 'moderate', allowing for easy replacement of data and text, making it practical for immediate use in real-world situations.
Usage Points
-
Main Usage
- This template is ideal for presenting financial insights during investment meetings or strategic planning sessions where stakeholders need to assess the profitability of PC games.
-
How to Use
- Users can input their own data into the template during presentations, allowing for real-time analysis and discussions based on current figures, which is valuable in making informed business decisions.
-
Recommended For
- This template is suitable for financial analysts, business consultants, and game development executives who are preparing reports or pitches to investors and partners.
-
Slide Structure
- The layout includes a clear profit and loss table, supported by visual elements that highlight key sales data, revenue streams, and trends, making it easy for viewers to follow the financial narrative.
Related Products
-

Sales and Profit Table – Visualizing Financial Performance
#Financial Plans and Performance #Diagram #Other
-

Business Sales and Profit Statement – Profit and Loss Visualization
#Financial Plans and Performance #Diagram #Other
-

Sales and Profit Comparison Graph & Table – Clear Financial Analysis
#Financial Plans and Performance #Diagram #Graph
-

Global Revenue Analysis Table – Table for Financial Performance Enhancement
#Financial Plans and Performance #Diagram #Other
