Competitor Analysis Trend Graph – Data-Driven Insights
RJ0300062_15
- Last Update 05/05/2025
- File Size 0.4MB
- # of Slides 2
- File Format PPTX
- Slide Ratio 16:9
- Color
Keywords
- #Content-Based Slides
- #Design-Based Slides
- #Market and Competitor Analysis
- #Graph
- #Competitor Analysis
- #Competitive Advantage
- #Line
- #Line Chart
- #16:9
- #line chart PowerPoint
- #dual-series trend graph
- #data visualization slides
- #how to create line chart in PowerPoint
- #competitive analysis slide template
About the Product
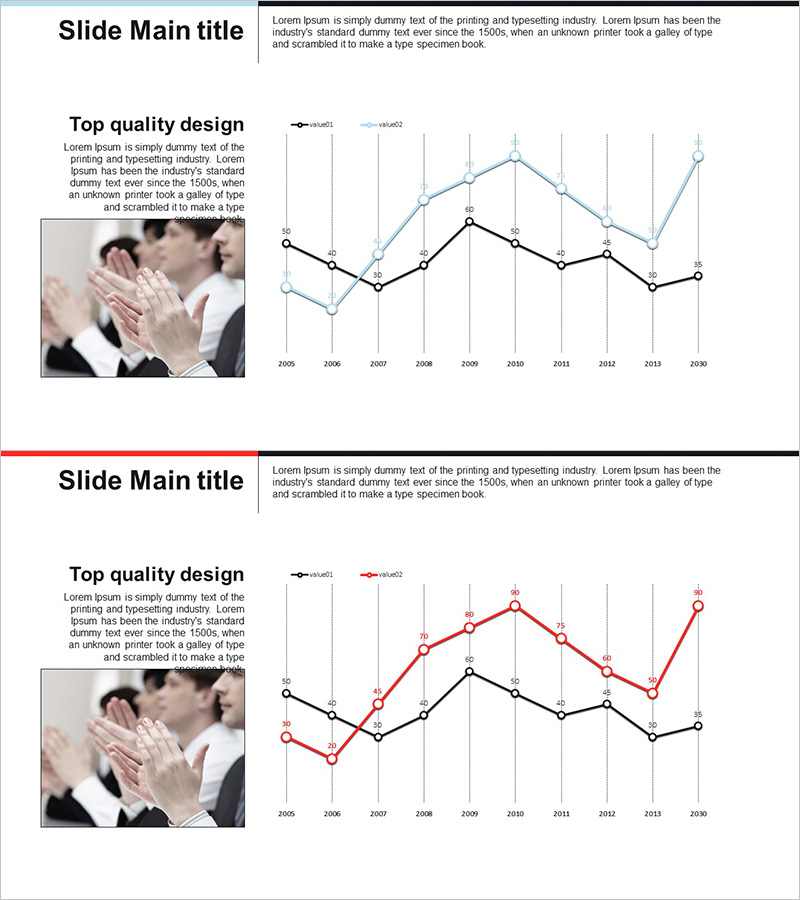
A 2-slide PowerPoint template set for visualizing competitive analysis and market trends. Two line series in black and blue (or red) display data changes from 2005 to 2030 with clear comparative insights. Each data point includes vertical gridlines and value labels for precise numerical comparison. This presentation slide deck is ready to use in business reports, strategic plans, investor pitches, and performance reviews.
Usage Points
-
Main Usage
Compare two data series simultaneously across a time period to identify trends and relative performance. Effective for competitor benchmarking, market share evolution, revenue comparison, and strategic performance analysis.
-
How to Use
Replace the sample data points and values with your actual figures. Use the legend to clearly identify each series. Leverage gridlines and value labels for accurate data reading. Deploy in executive briefings, investor presentations, strategy meetings, and board reports.
-
Recommended For
Executives, marketing managers, strategy planners, sales leaders, consultants, financial analysts, and data-driven decision makers. Suitable for quarterly performance reports, annual business plan presentations, competitive analysis reports, and market research findings.
-
Slide Structure
2-slide set. Each slide contains a title area, descriptive text, and dual-series line chart. Chart features 2005-2030 X-axis, numerical Y-axis, 2 data series (black and blue or black and red), vertical gridlines with value labels at each data point, and legend.
Related Products
-

Default Line Graph for Market & Competitor Analysis – Competitive Advantage
#Market and Competitor Analysis #Graph #Competitor Analysis
-

Modern Theme Competitor Analysis Graph
#Market and Competitor Analysis #Graph #Competitor Analysis
-

Competition Graphs and Analysis – Slides for Market Advantage
#Market and Competitor Analysis #Graph #Competitor Analysis
-

Neon Tone Competitor Analysis Broken Line Graph
#Market and Competitor Analysis #Graph #Competitor Analysis
