Company History Diagram – Visualizing Company Timeline
RJ0400051_5
- Last Update 05/31/2025
- File Size 4.6MB
- # of Slides 2
- File Format PPTX
- Slide Ratio 16:9
- Color
Keywords
About the Product
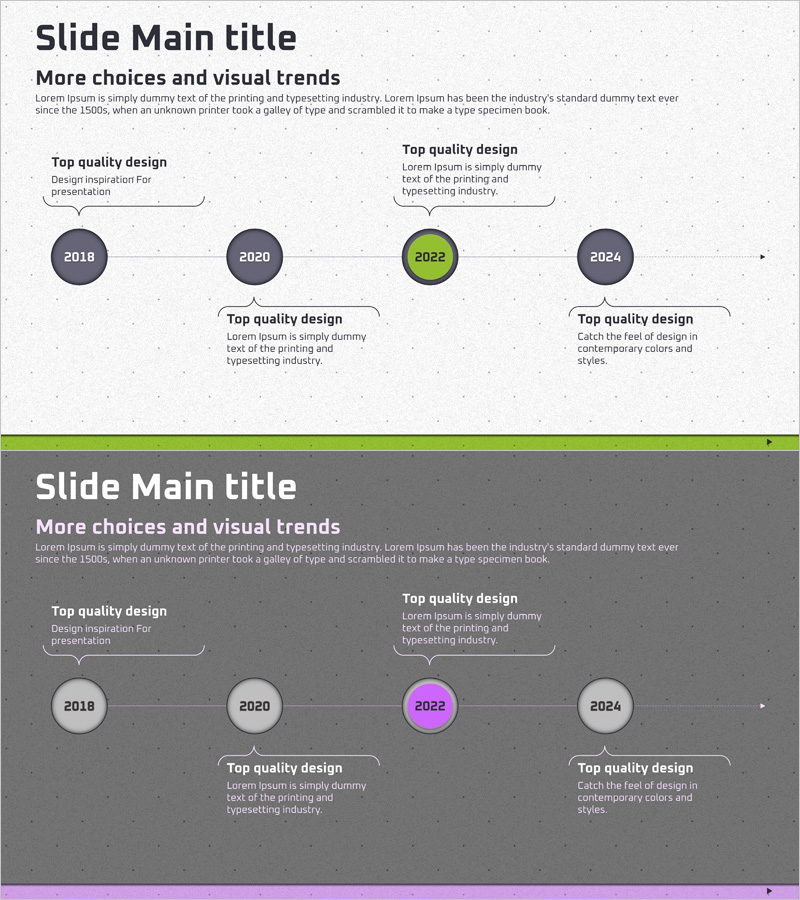
A timeline connection diagram PowerPoint slide that visually represents your company's key milestones and growth journey. This 2-slide template features 4 connected nodes arranged in linear sequence, allowing you to showcase yearly events and achievements step by step. Available in two color versions—lime green accent with light background and magenta accent with dark gray background—each node includes text input areas and descriptive callout boxes. Perfect for company presentations, corporate profiles, and business history decks. Delivered in 16:9 widescreen PPTX format for easy editing and customization.
Usage Points
-
Main Usage
Effectively communicate your organization's key milestones, growth phases, and historical achievements in chronological order. Ideal for investor presentations, corporate introductions, and company overview decks where clear visualization of business evolution is essential.
-
How to Use
Enter year or date information in each node's input field, then add corresponding milestone descriptions or achievements in the callout boxes below. Choose between the lime accent version for a contemporary feel or the gray version for a more corporate, stable appearance based on your presentation context.
-
Recommended For
Corporate IR professionals, business development teams, company presentation creators, executive speakers, HR departments preparing employee onboarding materials, and marketing teams developing corporate promotional content.
-
Slide Structure
2-slide template with 4 circular nodes (2018, 2020, 2022, 2024) arranged horizontally in linear sequence. Each node features text input areas above and below, with descriptive callout boxes positioned strategically. Connecting arrows between nodes emphasize temporal progression and relationship flow.
Related Products
-

History Overlay Diagram – Company Introduction Slide
#Company Introduction #Diagram #History
-

History Flag Shape Diagram - Company Growth and Vision
#Company Introduction #Diagram #History
-

Spade Shape Theme History Diagram – Emphasizing Company Development
#Company Introduction #Diagram #History
-

Business History Connection Diagram
#Company Introduction #Diagram #History
