Fund Planning and Revenue Tables – Financial Performance Analysis
RJ0900010_17
- Last Update 08/18/2025
- File Size 1.7MB
- # of Slides 2
- File Format PPTX
- Slide Ratio 16:9
- Color
Keywords
- #Content-Based Slides
- #Design-Based Slides
- #Financial Plans and Performance
- #Diagram
- #Other
- #Capital Requirements
- #Sales and Revenue
- #Table
- #Standard Table
- #Mockup
- #16:9
- #financial table PowerPoint
- #revenue analysis slide template
- #fund planning table
- #financial performance chart
- #data table PPT slide download
About the Product
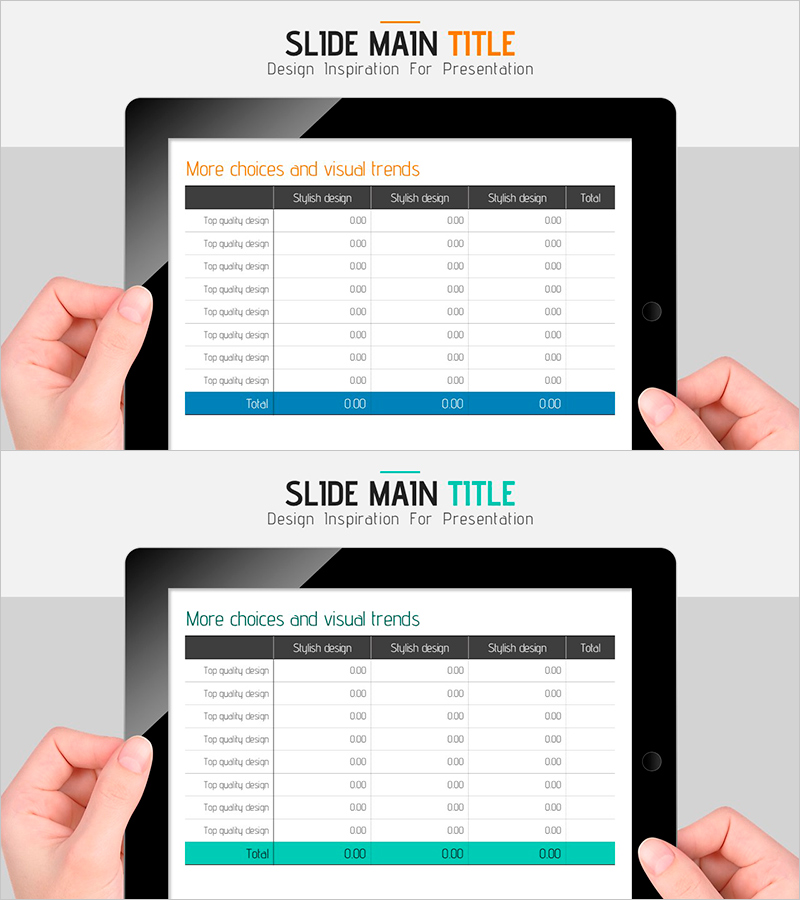
A professional PowerPoint slide featuring a structured data table for fund planning and revenue analysis. This presentation template displays 8 line items with quarterly financial metrics across 4 columns, enabling clear comparison of budget allocation and revenue performance. The orange header row and blue total row provide visual emphasis for key figures, making this slide ideal for financial reports, quarterly earnings presentations, and investor relations meetings. The 16:9 widescreen format includes 2 fully editable slides ready for immediate use in corporate financial disclosures and performance review sessions.
Usage Points
-
Main Usage
Presents financial data and revenue metrics in a structured tabular format to clearly communicate fiscal performance to investors, executives, and stakeholders during financial reviews and strategic planning sessions.
-
How to Use
Deploy in financial reports' performance analysis sections, quarterly earnings calls, investor relations (IR) presentations, and executive briefings to compare fund allocation and revenue trends across periods. Directly edit cell values to input actual financial data and customize row labels.
-
Recommended For
CFOs, financial analysts, business development managers, investor relations professionals, and accounting teams presenting quarterly financial results, revenue forecasts, budget allocations, and fiscal performance metrics.
-
Slide Structure
Organized as an 8-row by 4-column table with item descriptions in the first column and three quarterly data columns. Orange header row highlights column categories; blue total row emphasizes aggregate figures. All cells are editable for custom data entry.
Related Products
-

Diagram Slide for Funding Plans and Sales Statements
#Financial Plans and Performance #Diagram #Capital Requirements
-

Infinite Energy Wide PPT Table Analysis – Core of Financial Planning
#Financial Plans and Performance #Diagram #Capital Requirements
-

Sales and Profit Table – Clear Visualization of Financial Planning
#Financial Plans and Performance #Diagram #Other
-

Estimated Income Report Analysis Table – Financial Planning and Performance
#Financial Plans and Performance #Diagram #Capital Requirements
