Visualizing Internet of Things Market Trends with Bar Chart
RJ0400049_4
- Last Update 05/30/2025
- File Size 0.2MB
- # of Slides 2
- File Format PPTX
- Slide Ratio 16:9
- Color
Keywords
About the Product
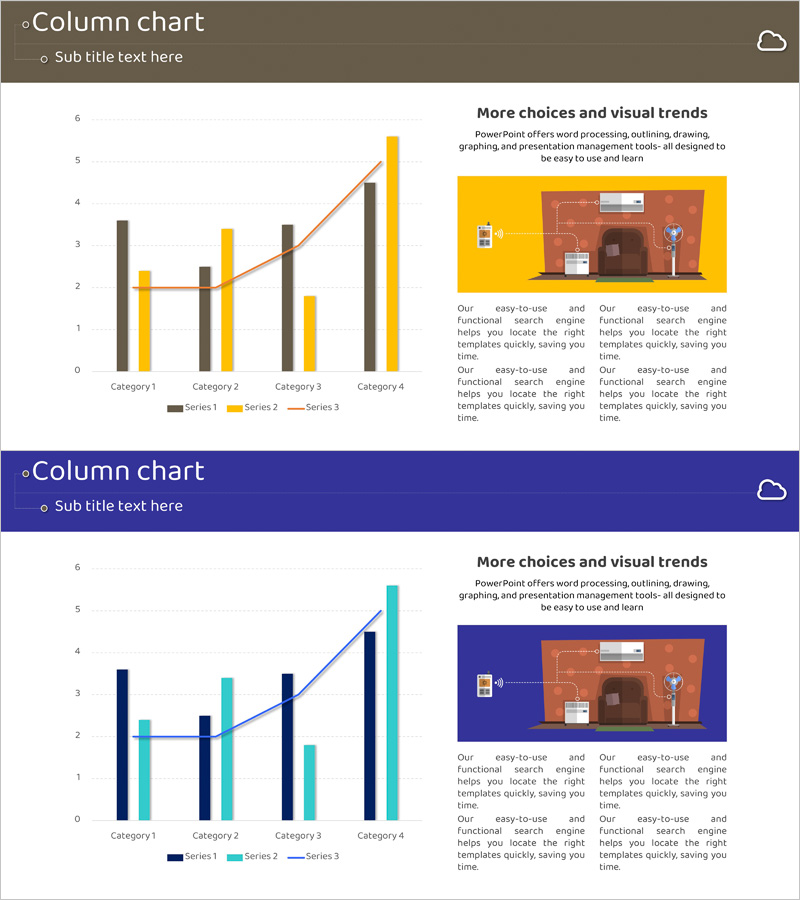
A mixed chart PowerPoint slide that compares Internet of Things market trends across four categories. This presentation template combines vertical bar graphs in three data series (brown, yellow, gray) with an orange trend line to visualize both comparative values and overall progression. The 2-slide set offers two color themes: brown and navy backgrounds, each with title, subtitle, and right-side description text box. Ideal for data-driven presentations where complex information needs clear visual communication and immediate deployment.
Usage Points
-
Main Usage
Display multiple data series side-by-side while emphasizing trend progression through a hybrid chart format. Vertical bars enable category-by-category comparison while the trend line highlights overall movement, supporting data-informed decision-making.
-
How to Use
Apply in market analysis, business reports, and investor pitch presentations when explaining multiple metrics simultaneously. Add analysis insights and key findings to the right-side text box to enhance audience comprehension. Customize color themes to match your corporate branding.
-
Recommended For
Executives, analysts, marketers, and strategists presenting market trends, sales performance, and KPI metrics. Particularly effective for IoT, digital transformation, and technology sector projects where data credibility strengthens business cases.
-
Slide Structure
Each slide features a colored header (brown or navy), four category axes, three vertical bar series (brown, yellow, gray), an orange trend line, and a right-aligned description text box. Legend positioned at bottom clearly distinguishes each data series.
Related Products
-

Competitor Market Trend Analysis Graph – Essential Tool for Market Understanding
#Market and Competitor Analysis #Graph #Market Analysis
-

Vertical Bar PC Mockup Graph – Market and Competitive Analysis
#Market and Competitor Analysis #Graph #Other
-

5-Year Real Estate Volume Chart – Market Analysis
#Market and Competitor Analysis #Graph #Market Analysis
-

Market Trend Analysis with Horizontal Bar Stacked Chart – Detailed Data Presentation
#Market and Competitor Analysis #Graph #Market Analysis
