Competitor Market Trend Analysis Graph – Essential Tool for Market Understanding
RJ0300072_11
- Last Update 05/08/2025
- File Size 0.1MB
- # of Slides 2
- File Format PPTX
- Slide Ratio 16:9
- Color
Keywords
About the Product
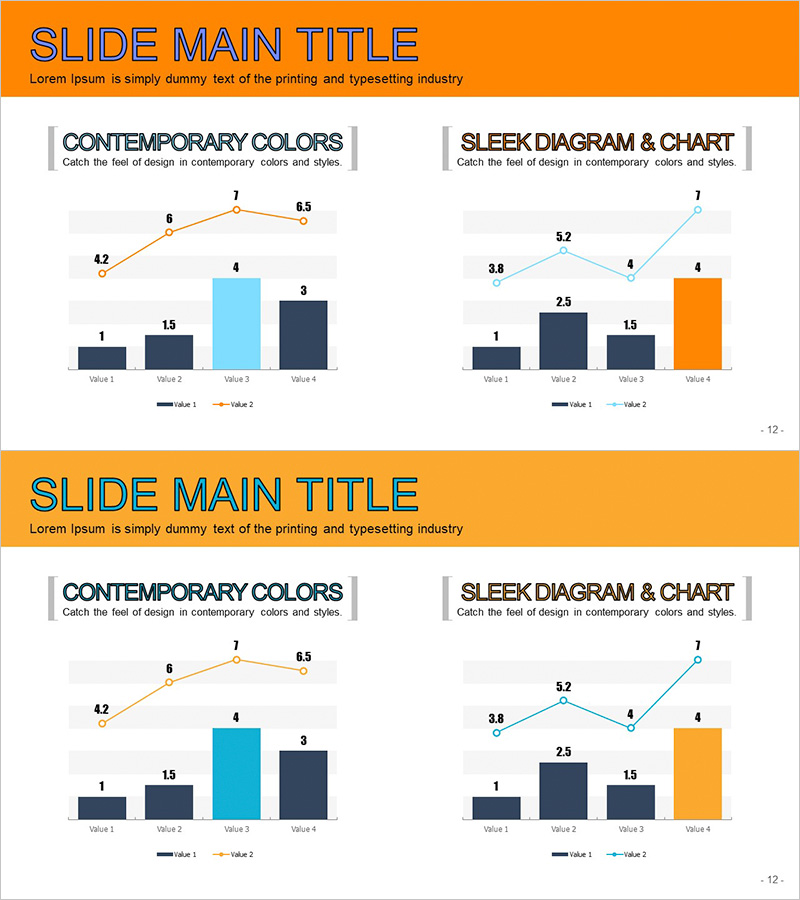
A hybrid PowerPoint slide combining line and bar charts to visualize competitor market trends and performance metrics simultaneously. The design features orange, blue, and navy color schemes with clear data series differentiation through legend markers. Two data series are displayed side-by-side: a line graph showing trend progression and bar columns representing comparative values across four data points. Ideal for business presentations, market analysis reports, competitive positioning, and sales performance reviews. Fully editable PPTX format with customizable data labels and color schemes.
Usage Points
-
Main Usage
This hybrid chart design enables simultaneous comparison of trend progression and quantitative values across multiple data points. The line graph emphasizes directional change while bar columns highlight absolute figures, making it ideal for competitive analysis, market positioning, and performance reporting where both trajectory and magnitude matter.
-
How to Use
Replace the four data values (Value 1-4) with your actual metrics. Input line series data (orange) and bar series data (blue/navy) separately using the chart editing tools. Modify axis labels, legend text, and data point labels to match your presentation context. Colors and fonts can be adjusted to align with corporate branding guidelines.
-
Recommended For
Marketing directors, business strategists, sales executives, and financial analysts presenting market analysis, competitive intelligence, quarterly performance reviews, and investor presentations. Particularly effective for visualizing sales trends, market share comparisons, customer satisfaction metrics, and year-over-year growth analysis.
-
Slide Structure
Two-slide set in 16:9 widescreen format (PPTX). Slide 1 features an orange header with title area, left-aligned line graph (2 series, 4 data points), and right-aligned bar chart (4 categories). Slide 2 presents the same data structure with alternative color emphasis. Both slides include legend, axis labels, and value annotations for clarity.
Related Products
-

Visualizing Internet of Things Market Trends with Bar Chart
#Market and Competitor Analysis #Graph #Market Analysis
-

Market Analysis Vertical Bar Graph
#Market and Competitor Analysis #Graph #Market Status
-

Modern Blue Presentation Area Chart - Optimized for Market Analysis
#Market and Competitor Analysis #Graph #Other
-

Market Trend Analysis Chart – Effective Data Visualization
#Market and Competitor Analysis #Graph #Market Analysis
