Service Sector Development Status Graph – Visualizing Competitive Edge with Doughnut Chart
RJ0400049_26
- Last Update 05/30/2025
- File Size 0.2MB
- # of Slides 2
- File Format PPTX
- Slide Ratio 16:9
- Color
Keywords
- #Content-Based Slides
- #Design-Based Slides
- #Product/Service Introduction
- #Market and Competitor Analysis
- #Graph
- #Development Status
- #Competitive Advantage
- #Circles
- #Doughnut Chart
- #16:9
- #doughnut chart PowerPoint
- #pie chart slide template
- #multi-layer data visualization
- #concentric circle graph
- #percentage comparison slide
About the Product
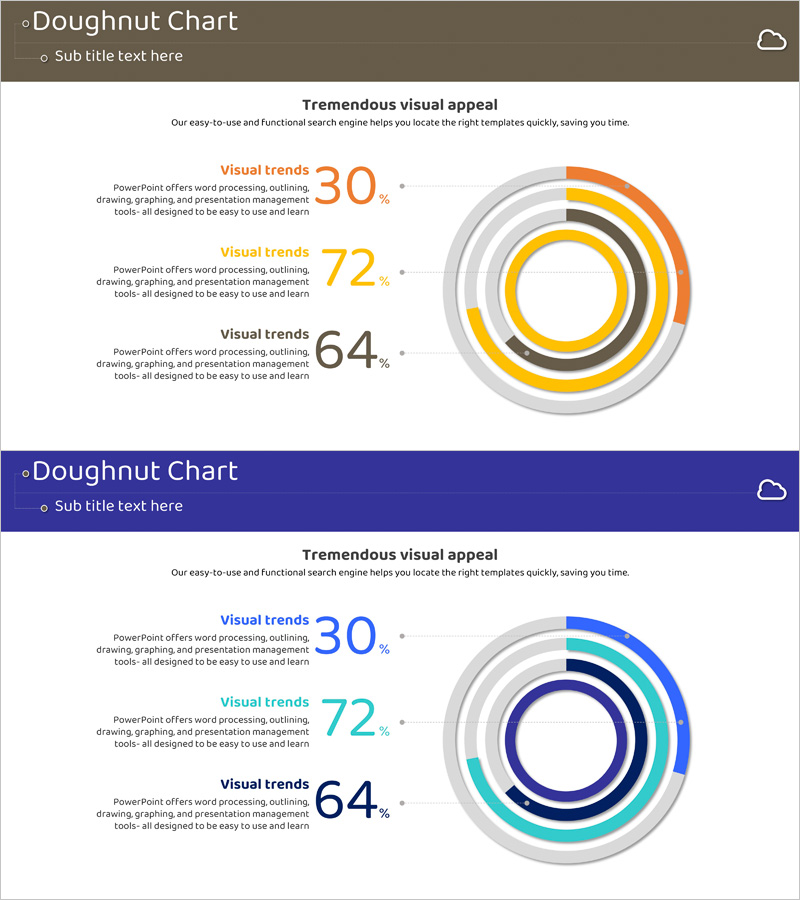
A PowerPoint slide featuring a 3-layer concentric doughnut chart for visualizing service sector development status and competitive positioning. Two color schemes are provided: warm tones (orange, yellow, gray) and cool tones (navy, cyan), allowing you to match your presentation theme and audience mood. Each layer clearly displays percentage values (30%, 72%, 64%) for flexible use in competitive analysis, market share representation, performance composition, and multi-dimensional data comparison. The 2-slide set is optimized for 16:9 widescreen format with fully editable elements for immediate integration into your presentation.
Usage Points
-
Main Usage
Presents three-dimensional data such as service sector development, market share distribution, and competitive advantage through a layered concentric structure. Each layer's percentage is prominently displayed, enabling audiences to intuitively understand data relationships and proportional weight at a glance.
-
How to Use
Deploy in business presentations, strategy meetings, and performance reports to communicate complex data effectively. The warm-tone version creates an optimistic, approachable atmosphere, while the cool-tone version conveys professional credibility and trust. Customize layer labels and percentages to match your content and deploy immediately.
-
Recommended For
Recommended for executives, marketing teams, sales professionals, consultants, and data analysts requiring data-driven decision-making. Applicable to business performance analysis, market landscape explanation, competitor benchmarking, customer segmentation, and portfolio composition presentations.
-
Slide Structure
2-slide set. Each slide contains one 3-layer concentric doughnut chart. Two-column layout with text area (title and description) on the left and chart on the right. Percentage labels and legend included per layer. All shapes and text elements are fully editable.
Related Products
-

Drone Performance Comparison Analysis Graph – Data Visualization
#Product/Service Introduction #Market and Competitor Analysis #Graph
-

Ranking of Vegetables that Children Dislike – Fun and Engaging
#Product/Service Introduction #Market and Competitor Analysis #Diagram
-

Component Development Scale Pie Chart – Visualization of Competitive Advantage
#Product/Service Introduction #Market and Competitor Analysis #Graph
-

Visualizing Competitive Advantage with Circular Gauge Charts
#Product/Service Introduction #Market and Competitor Analysis #Graph
