Competitor Year-over-Year Comparison Line Graph – Reliability in Market Analysis
RJ0400049_18
- Last Update 05/30/2025
- File Size 0.2MB
- # of Slides 2
- File Format PPTX
- Slide Ratio 16:9
- Color
Keywords
About the Product
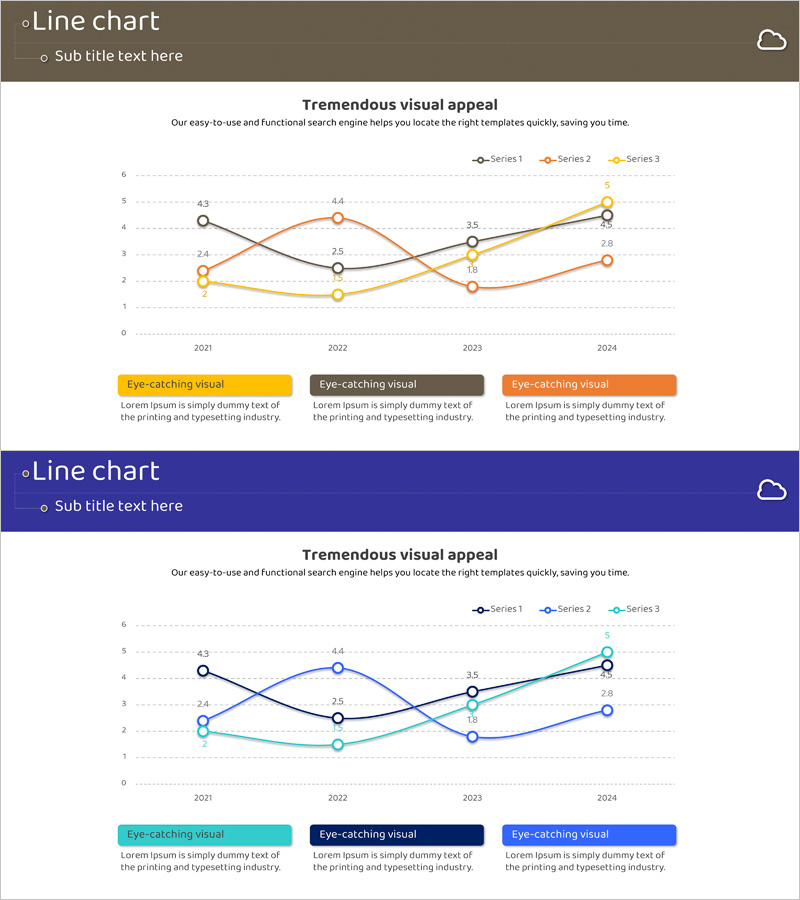
A PowerPoint slide optimized for market analysis and competitive benchmarking, featuring a multi-line chart comparing three data series from 2021 to 2024. The slide clearly illustrates competitive positioning and performance trends across a four-year period. Two design variants are provided: brown and blue backgrounds, each with dedicated areas for title, subtitle, chart, and descriptive text. The intuitive layout enables direct comparison of numerical data, making it ideal for investor presentations, executive briefings, and strategic marketing planning. Fully editable PPTX format allows instant customization of data and labels.
Usage Points
-
Main Usage
Visualize competitive performance metrics, market share trends, revenue, customer growth, or market response across multiple years to objectively demonstrate competitive advantage. Supports data-driven decision-making in investor relations, executive meetings, and strategic marketing presentations.
-
How to Use
Input actual competitor data into the three data series (Series 1, 2, 3) and update legend labels and description text boxes accordingly. Select either the brown or blue background version to match your corporate branding. Modify the year labels (2021–2024) as needed for your analysis period.
-
Recommended For
Ideal for executives, business development teams, marketing departments, and finance teams presenting competitive analysis results. Particularly effective for investor pitches, quarterly business reviews, new market entry strategies, and competitive landscape assessments.
-
Slide Structure
Each slide features a title and subtitle area at the top, a central line chart with four time points, three data series with value labels, and three description boxes (yellow, gray, orange) at the bottom. Eight editable text areas (1 title, 1 subtitle, 3 legend labels, 3 description boxes) enable complete customization.
Related Products
-

Camera Bar Graph Paired – Market Analysis and Competitive Edge
#Market and Competitor Analysis #Graph #Market Analysis
-

Travel Guide Market Analysis by State in the United States Using Horizontal Bar Chart
#Market and Competitor Analysis #Graph #Other
-

Office Interior Analysis Graph - Visualizing Competitive Advantage
#Market and Competitor Analysis #Graph #Market Analysis
-

Circular Gradient Wide Template Bundled Charts
#Market and Competitor Analysis #Graph #Market Analysis
