Internet Shopping Future Outlook Analysis Graph – Future Predictions
RJ0400046_5
- Last Update 05/29/2025
- File Size 0.6MB
- # of Slides 2
- File Format PPTX
- Slide Ratio 16:9
- Color
Keywords
About the Product
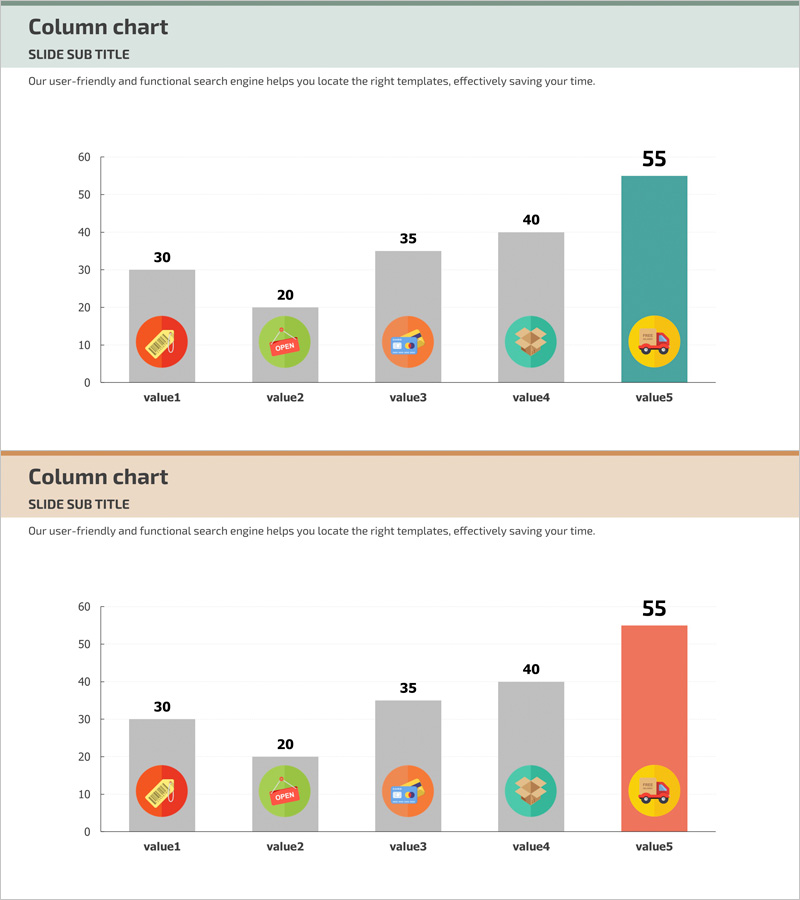
A vertical column chart PowerPoint slide designed to visualize internet shopping market analysis and future outlook projections. This presentation template effectively compares five data points with clear numerical values displayed above each column. The design incorporates colorful icons beneath each bar—shopping bag, gift, shopping cart, network, and vehicle—to represent different categories intuitively. The color palette combines gray, orange, green, teal, and coral tones to emphasize data variations, with the final column highlighted in coral to draw attention to the highest value. The 2-slide set is ready for immediate use in business presentations, reports, and market analysis meetings.
Usage Points
-
Main Usage
This slide visualizes comparative data across five categories—such as market size, sales performance, growth rates, or future predictions—using vertical columns. The bar heights clearly represent numerical differences, while icons below each column provide visual category identification, enhancing audience comprehension.
-
How to Use
Use this template in marketing plans, business reports, investor presentations, and market analysis meetings. Replace the numerical values with your own data, customize the icons and colors to match your brand identity, and adjust the chart title and subtitle to reflect your specific analysis focus.
-
Recommended For
Marketing professionals, business analysts, strategists, and executives presenting market research findings and data-driven insights. Ideal for e-commerce, retail, and internet shopping industry presentations where comparative analysis and future projections are central to the message.
-
Slide Structure
2-slide set. First slide features five gray columns (values 30, 20, 35, 40, 55) with icons and data labels. Second slide presents a variation with the final column highlighted in coral to emphasize peak performance. Y-axis ranges from 0 to 60 with gridlines; each column includes an icon (shopping bag, gift box, shopping cart, network, delivery vehicle) for category identification.
Related Products
-

Rise and Fall Vertical Bar Graph – Essential for Market Analysis
#Market and Competitor Analysis #Graph #Future Outlook
-

Future Outlook Analysis Bar Graph – Essential for Market Analysis
#Market and Competitor Analysis #Graph #Future Outlook
-

A Bar Graph Showing Future Prospects
#Market and Competitor Analysis #Graph #Future Outlook
-

Future Outlook Vertical Bar Graph – Market Analysis
#Market and Competitor Analysis #Graph #Future Outlook
