Market Analysis Comparison Graph – Insights into Future Trends
RJ0300023_23
- Last Update 04/23/2025
- File Size 0.3MB
- # of Slides 2
- File Format PPTX
- Slide Ratio 16:9
- Color
Keywords
- #Content-Based Slides
- #Design-Based Slides
- #Market and Competitor Analysis
- #Graph
- #Future Outlook
- #Market Analysis
- #Column
- #Column Chart
- #16:9
- #vertical bar chart PowerPoint
- #bar graph slide template
- #market analysis chart
- #comparison chart PPT
- #data visualization slides
- #how to create bar chart in PowerPoint
About the Product
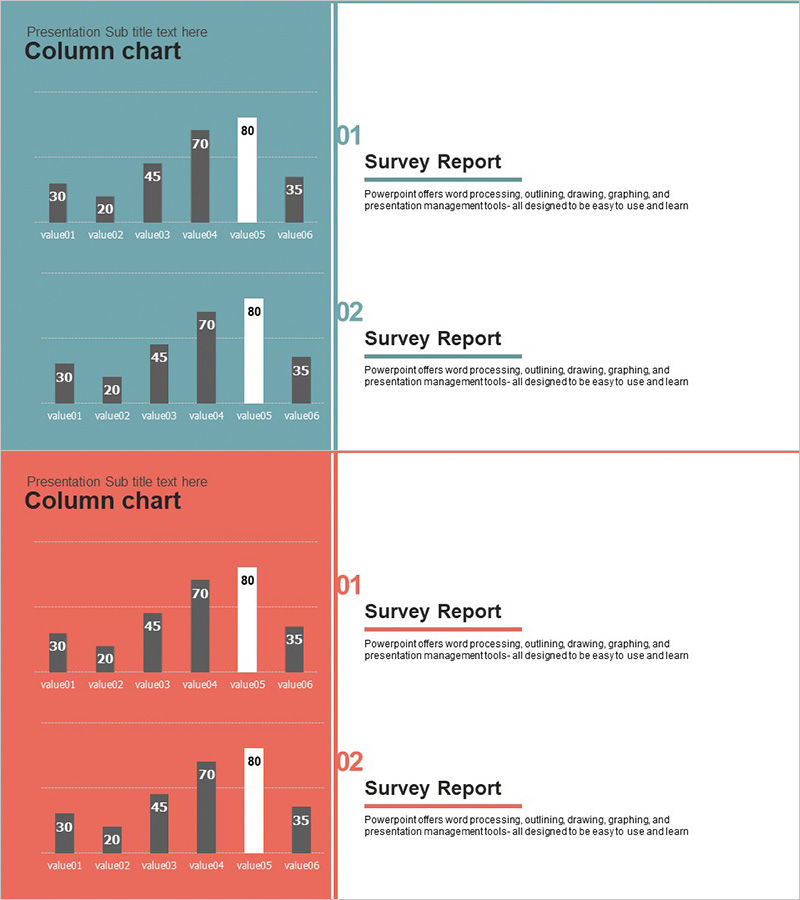
A vertical bar chart PowerPoint slide designed for market analysis and future outlook presentations. This slide deck features six data items (value01 through value06) displayed as vertical bars against teal and coral backgrounds, with a maximum value of 80 as the reference point. The two-slide set presents identical data with color variations, allowing you to emphasize key insights through visual contrast. In 16:9 widescreen PPTX format, fully editable and ready to integrate into marketing strategies, business analysis reports, market research presentations, and competitive benchmarking documents.
Usage Points
-
Main Usage
Visualize comparative data across six items—such as market segments, competitor metrics, sales performance, or future projections—using vertical bars. The 80-point scale provides a clear reference for relative magnitude, enabling audiences to grasp differences at a glance and make data-driven decisions.
-
How to Use
Replace item labels (value01–value06) and corresponding values (30, 20, 45, 70, 80, 35) with your actual data in the slide master. Choose between the teal or coral background version based on your presentation tone, or use both slides to create visual emphasis and reinforce key findings.
-
Recommended For
Marketing managers, sales directors, business strategists, financial analysts, and product managers presenting market research, sales performance reviews, competitive analysis, or strategic forecasts. Ideal for quarterly reports, strategy meetings, investor presentations, and board-level discussions requiring data-backed insights.
-
Slide Structure
Two-slide set. Each slide contains one vertical bar chart (six bars representing value01–value06) on the left, paired with a text area on the right (Survey Report title and descriptive text). Slide 1 uses a teal background; Slide 2 uses a coral background, maintaining identical data structure with color variation for visual impact.
Related Products
-

Profit Forecast Graph
#Market and Competitor Analysis #Graph #Future Outlook
-

Future Outlook Analysis Bar Graph – Essential for Market Analysis
#Market and Competitor Analysis #Graph #Future Outlook
-

A Bar Graph Showing Future Prospects
#Market and Competitor Analysis #Graph #Future Outlook
-

Future Outlook Vertical Bar Graph – Market Analysis
#Market and Competitor Analysis #Graph #Future Outlook
