Business Future Outlook Analysis Diagram - Market Analysis and Competitive Advantage
RJ0300071_14
- Last Update 05/08/2025
- File Size 0.3MB
- # of Slides 2
- File Format PPTX
- Slide Ratio 16:9
- Color
Keywords
- #Content-Based Slides
- #Design-Based Slides
- #Market and Competitor Analysis
- #Graph
- #Future Outlook
- #Market Analysis
- #Column
- #Column Chart
- #16:9
- #vertical bar chart PowerPoint
- #bar graph presentation slide
- #business analysis diagram
- #market analysis chart
- #competitive analysis PPT
- #data visualization slide
About the Product
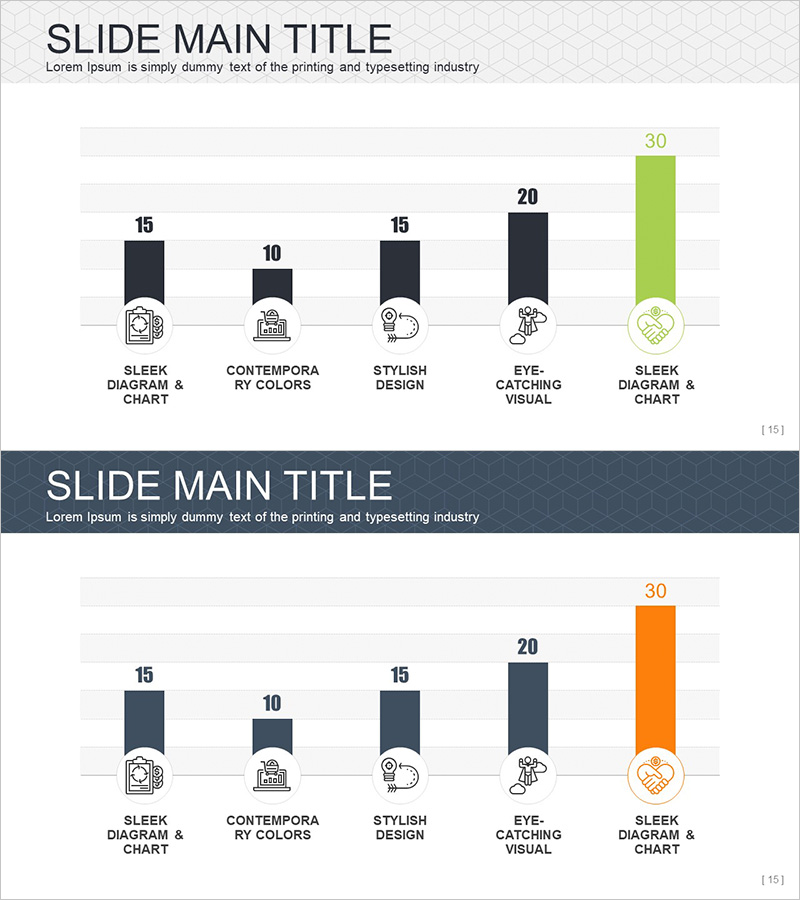
A vertical bar chart PowerPoint slide with 5 items designed to visualize business future outlook and market analysis. The design uses a two-tone color scheme of dark gray and lime green, with the final bar highlighted in lime green to emphasize key performance indicators. Each bar is labeled with an icon below to represent different categories, enhancing readability in business presentations. This slide deck supports data-driven decision-making during strategic planning phases, including competitive advantage assessment, market trends, and competitor analysis. The 16:9 widescreen format with 2 slides is ready for immediate editing and use.
Usage Points
-
Main Usage
This slide effectively compares and analyzes quantitative data such as business outlook, market analysis, and competitor benchmarking. The 5 bars allow direct numerical comparison, while the lime green highlight on the final bar emphasizes critical KPIs or target values.
-
How to Use
Use this slide in business strategy presentations, quarterly performance reports, and market entry planning to explain competitive metrics. Edit the numerical values to input actual data, and customize the icon labels to match your specific analysis categories.
-
Recommended For
Ideal for executives, business development teams, marketing departments, and strategic planning teams presenting at board meetings, investor pitches, and business plan presentations. Recommended for any business presentation requiring quantitative comparative analysis.
-
Slide Structure
2-slide set with identical structure: the first slide features 5 dark gray bars, the second features the same layout with the final bar in lime green. Each bar includes an icon (briefcase, building, chat, person, handshake) and text label below for clear category identification. 16:9 widescreen format in PPTX, fully editable in all PowerPoint versions.
Related Products
-

Internet Shopping Future Outlook Analysis Graph – Future Predictions
#Market and Competitor Analysis #Graph #Future Outlook
-

Business Meeting Analysis Bar Graph Slide – Market and Competitive Analysis
#Market and Competitor Analysis #Graph #Future Outlook
-

Blue Red Analysis Chart – New Insights into Market Analysis
#Market and Competitor Analysis #Diagram #Graph
-

Future Outlook Analysis Bar Graph – Essential for Market Analysis
#Market and Competitor Analysis #Graph #Future Outlook
