Key Financial Indicators for Internet Shopping Business
RJ0400046_26
- Last Update 05/29/2025
- File Size 0.4MB
- # of Slides 2
- File Format PPTX
- Slide Ratio 16:9
- Color
Keywords
- #Content-Based Slides
- #Design-Based Slides
- #Business Strategy
- #Financial Plans and Performance
- #Diagram
- #Key Financial Indicators
- #Table
- #Background
- #16:9
- #financial metrics PowerPoint slide
- #financial analysis presentation
- #business financial table slide
- #ROI PowerPoint template
- #financial performance deck
About the Product
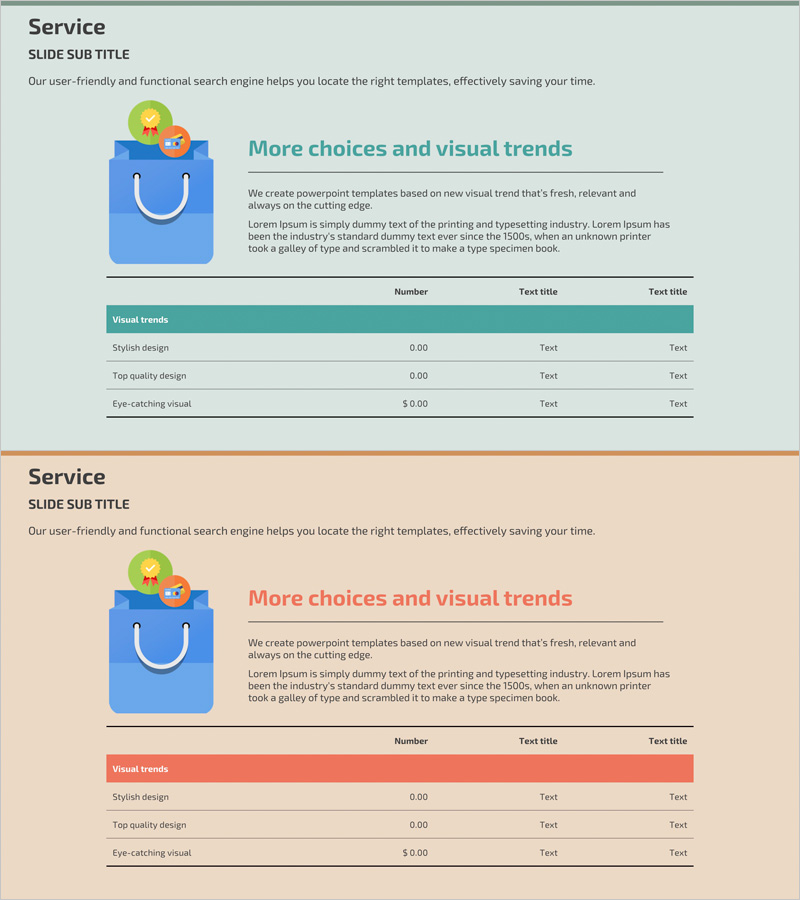
A professional PowerPoint slide presenting key financial indicators for an internet shopping business. This 2-slide deck features a teal header and gray background, with the first slide introducing the business overview alongside a shopping bag illustration, and the second slide displaying financial metrics in a structured table format. The three-column table layout (metric name, numerical value, description) clearly communicates financial data for investor presentations and executive reports. Delivered in 16:9 widescreen PPTX format, fully editable with customizable colors, fonts, and data fields for immediate use.
Usage Points
-
Main Usage
Presents core financial indicators (revenue, profit margin, ROI, cash flow) in a clear table format to investors, executives, and stakeholders. Transforms complex numerical data into a high-readability layout that provides credible decision-making support and financial transparency.
-
How to Use
Start with the first slide to establish business context and key messages, then present the second slide's table with actual financial figures. Highlight specific metrics or use color coding to draw audience attention. Ideal for business plans, investor decks, and quarterly earnings presentations.
-
Recommended For
CFOs, finance managers, and business planning teams presenting to investors, shareholders, and executives. Suitable for startup funding pitches, corporate quarterly results announcements, and new business feasibility assessments.
-
Slide Structure
Two-slide layout: ① Title slide with business name, shopping illustration, and three text areas for key messages ② Financial metrics table with three columns (metric, value, description) and expandable rows. Teal header provides visual hierarchy while gray background enhances data readability.
Related Products
-

Robot Business Revenue and Sales Analysis Table – A Systematic Approach to Financial Planning
#Financial Plans and Performance #Diagram #Income Statement
-

Learning Illustrations and Table Charts – Visualizing Financial Performance
#Financial Plans and Performance #Diagram #Income Statement
-

Business Table Charts – Intuitively Presenting Financial Performance
#Financial Plans and Performance #Diagram #Projected Return on Investment (ROI)
-

New Semester Template Table – Visualizing Financial Planning and Performance
#Financial Plans and Performance #Diagram #Projected Return on Investment (ROI)
