Red Purple Highlight Table – An Ideal Choice for Financial Planning
RJ0500039_14
- Last Update 06/17/2025
- File Size 0.5MB
- # of Slides 2
- File Format PPTX
- Slide Ratio 16:9
- Color
Keywords
- #Content-Based Slides
- #Design-Based Slides
- #Financial Plans and Performance
- #Diagram
- #Budget
- #Key Financial Indicators
- #Table
- #Standard Table
- #16:9
- #data table PowerPoint slide
- #financial table template
- #6-column table slide
- #table PPT design
- #numerical comparison slide
- #how to create data table in PowerPoint
About the Product
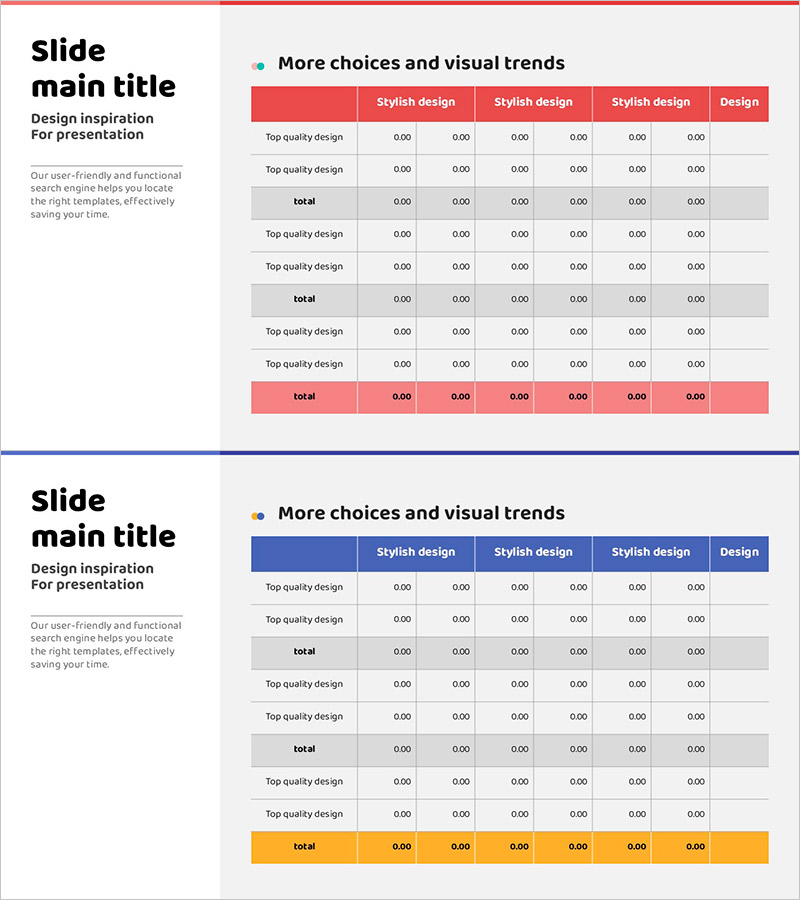
A 6-column data table PowerPoint slide designed for organizing financial data and key performance indicators. The red and purple header row clearly separates the data sections, while the gray-background total row emphasizes overall figures. Each row accommodates 'Top quality design' labels and numerical data in 0.00 format. The 2-slide set is optimized for 16:9 widescreen displays in PPTX format, enabling you to present financial status, performance metrics, and budget comparisons at a glance. Ready to use immediately in presentations, reports, and business proposals for systematic data communication.
Usage Points
-
Main Usage
This slide organizes and visualizes numerical data such as financial status, performance metrics, and budget comparisons in table format. The red and purple header row clearly delineates data sections, while the gray-background total row emphasizes overall figures and captures audience attention.
-
How to Use
Use in financial reports, business performance presentations, and investment proposals to organize quarterly results, departmental budgets, and product sales volumes. Edit header text and data cells to match your information, and leverage color emphasis to highlight critical metrics.
-
Recommended For
Recommended for finance teams, executives, marketing teams, and project managers who require data-driven reporting. Suitable for quarterly performance presentations, budget review meetings, investor briefings, and internal performance sharing sessions.
-
Slide Structure
A 2-slide set featuring data tables with 6 columns and multiple rows. The top header row is emphasized in red and purple tones, while middle data rows use white backgrounds with black text for readability. The bottom total row features a gray background to clearly distinguish overall figures.
Related Products
-

Modern Business Plan Presentation Template Text Diagram – Financial Performance and Budget Management
#Financial Plans and Performance #Diagram #Budget
-

Aurora Camping Business Key Financial Indicator Table
#Financial Plans and Performance #Diagram #Budget
-

Diet Meal Table – Healthy Financial Planning
#Financial Plans and Performance #Diagram #Budget
-

Green Standard Table – Financial Planning and Budget Analysis
#Financial Plans and Performance #Diagram #Budget
