Comparison Table of Two Topics – Effective Financial Management Material
RJ0500027_26
- Last Update 06/14/2025
- File Size 0.9MB
- # of Slides 2
- File Format PPTX
- Slide Ratio 16:9
- Color
Keywords
About the Product
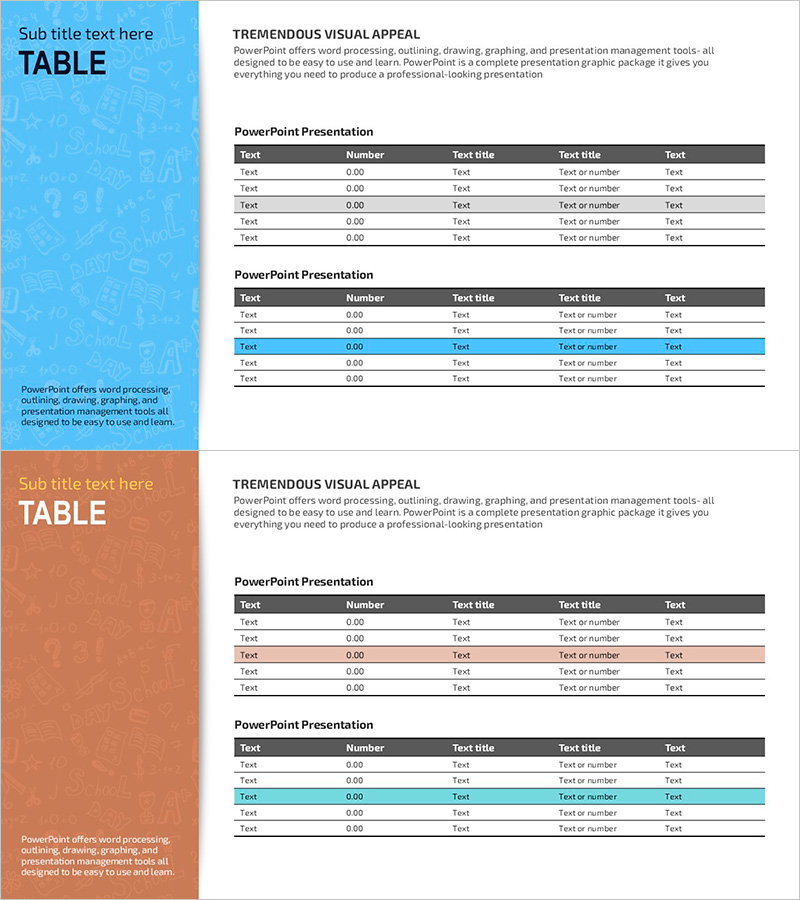
A PowerPoint slide designed to effectively compare financial management and performance analysis side by side. The table layout features blue and orange color schemes that clearly distinguish contrasting topics, with consistently arranged data entry fields in each row. The five-column structure accommodates numbers, text, and categories simultaneously, making it ideal for displaying financial metrics, budget items, and performance indicators. This PPT slide set is ready to use when comparing two scenarios, departments, or time periods in your presentation.
Usage Points
-
Main Usage
Compare financial plans against actuals, or present two business strategies, departmental performance, or market scenarios simultaneously. The slide accommodates mixed numeric and text data, making it suitable for financial reports, investor presentations, and executive meetings.
-
How to Use
Enter comparison item names in each row's text field and input numeric data in the number columns. Use the blue and orange slide variations alternately, or designate left and right columns within the same table for different topics.
-
Recommended For
Finance professionals, CFOs, and executives presenting budget versus actual results, year-over-year performance, or departmental KPI comparisons. Marketing teams can also use it effectively for competitive analysis and market share comparisons.
-
Slide Structure
Each slide contains five columns (item name, number, text title, text title, text) and five data entry rows. The header row features a dark gray background with white text for emphasis, while data rows alternate between white and light gray backgrounds for improved readability.
Related Products
-

Construction Business Balance Sheet - The Start of Clear Financial Management
#Financial Plans and Performance #Diagram #Balance Sheet
-

Visualizing Financial Performance with Standard Table Slide
#Financial Plans and Performance #Diagram #Balance Sheet
-

Balance Sheet Table Slide – Foundation for Financial Planning
#Financial Plans and Performance #Diagram #Balance Sheet
-

Balance Sheet Chart for Financial Planning Slide
#Financial Plans and Performance #Diagram #Balance Sheet
