Surgical Drape Theme Broken Line Graph - Competitor Analysis
RJ0400045_9
- Last Update 05/29/2025
- File Size 3MB
- # of Slides 2
- File Format PPTX
- Slide Ratio 16:9
- Color
Keywords
About the Product
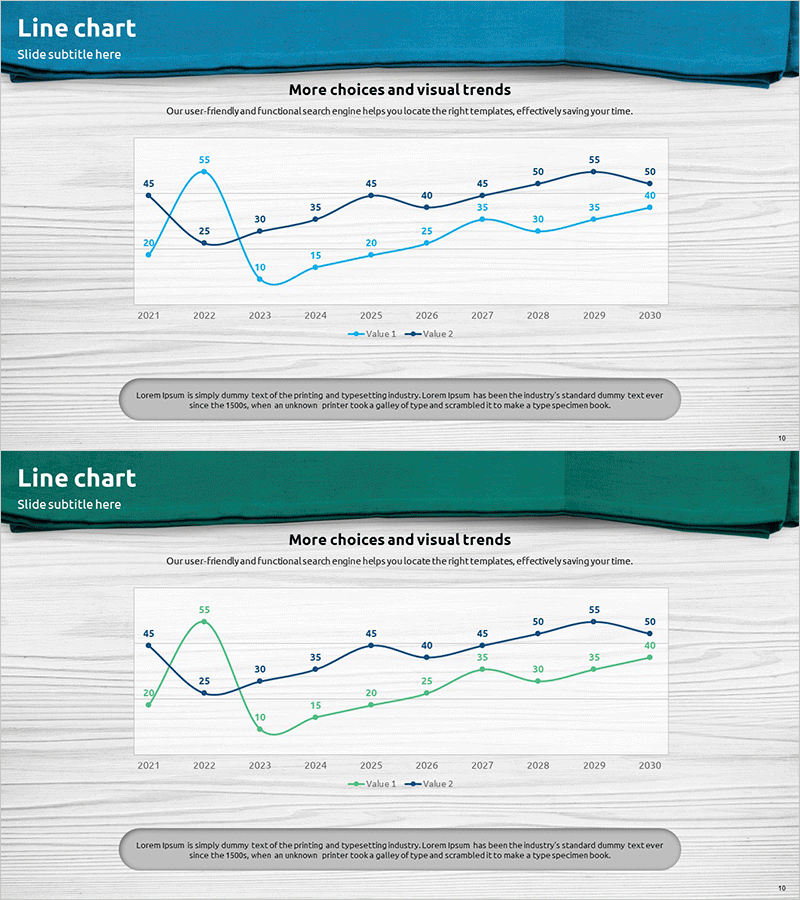
A professional line chart PowerPoint slide that visualizes two data series across a 10-year timeline from 2021 to 2030. The dual-line design uses light blue and dark blue to represent Value 1 and Value 2, with precise numerical labels at each data point for accurate information delivery. This presentation template is ideal for competitor analysis, market trend analysis, revenue forecasting, customer satisfaction tracking, and comparative performance reporting. The 16:9 widescreen format with 2-slide layout enables quick customization for various business presentations and strategic discussions.
Usage Points
-
Main Usage
Designed to compare two related data series over time, enabling simultaneous analysis of parallel trends. Perfect for displaying competitive performance metrics, market share evolution, revenue versus cost trends, customer satisfaction versus churn rates, and other correlated business indicators in a single visual.
-
How to Use
Simply replace the existing data points and numerical values with your actual statistics. Both line colors (light blue and dark blue) are fully editable, and you can modify the year range, legend labels, and descriptive text to match your specific presentation needs. Suitable for executive briefings, investor presentations, and strategic planning sessions.
-
Recommended For
Ideal for executives, finance teams, marketing professionals, sales managers, business analysts, and consultants who rely on data-driven decision making. Particularly effective for quarterly and annual performance reports, competitive landscape presentations, market research findings, and investment proposal documents.
-
Slide Structure
Two identical slides featuring a title area, dual-line chart with 10 data points spanning 2021-2030, legend identifying Value 1 and Value 2, and a descriptive text box. The chart includes X-axis (years), Y-axis (numerical values), two distinct line series, and labeled data points for precise value reference.
Related Products
-

Blue Green Broken Line Graph – Optimized for Competitor Analysis Design
#Market and Competitor Analysis #Graph #Competitor Analysis
-

Line Graph Analysis Slide – Analyze the Market with Blue and Navy
#Market and Competitor Analysis #Graph #Competitor Analysis
-

Curve Chart of Architectural Topics
#Market and Competitor Analysis #Graph #Competitor Analysis
-

Infinite Energy Wide PPT Line Chart
#Market and Competitor Analysis #Financial Plans and Performance #Graph
