Infographic Slide for Effective Communication – Creative Visualization
RJ0400044_7
- Last Update 05/29/2025
- File Size 0.5MB
- # of Slides 2
- File Format PPTX
- Slide Ratio 16:9
- Color
Keywords
About the Product
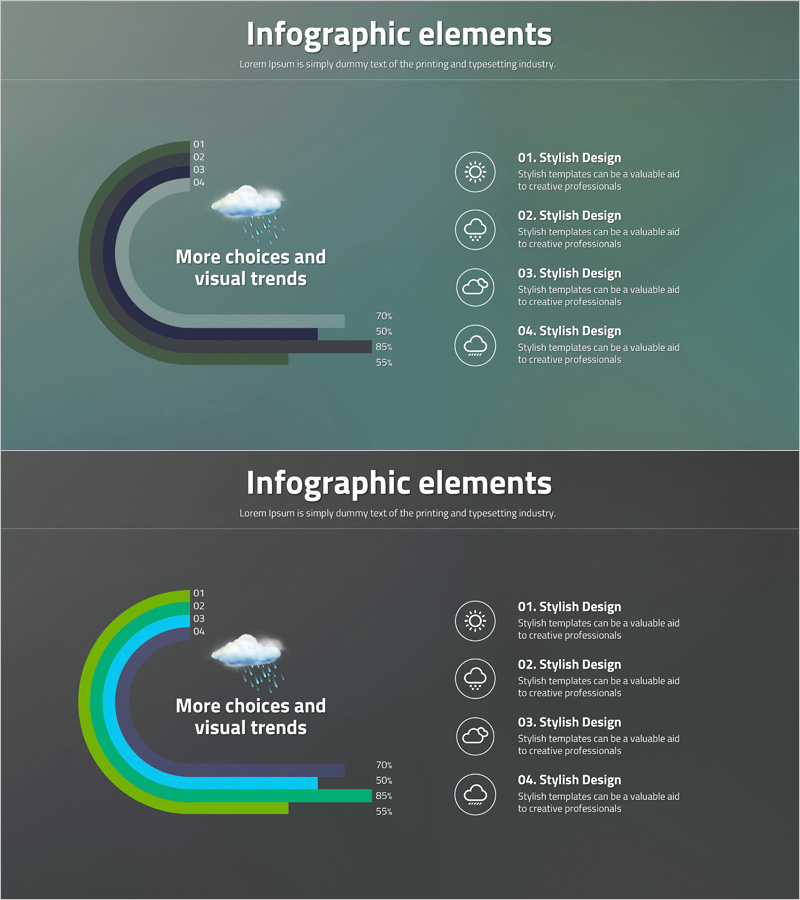
Communicate customer analysis and market data effectively with this infographic PowerPoint slide. The 2-slide set features multi-layer circular charts and icon-based layouts, ready to use in company profiles, marketing presentations, and analytical reports. Designed with sage green and charcoal gray backgrounds, layered circular charts, weather icons, and right-aligned text boxes that enable side-by-side comparison of numerical data and descriptions. Available in 16:9 widescreen PPTX format, fully editable in all PowerPoint versions.
Usage Points
-
Main Usage
Present quantitative information such as customer analysis, market trends, and data comparisons in an intuitive visual format. The multi-layer circular chart structure allows simultaneous representation of multiple data hierarchies, while the right-side icon text boxes clarify the meaning of each data point.
-
How to Use
Incorporate into marketing plans, customer analysis reports, quarterly performance presentations, and market research findings as your data visualization section. Simply edit the circular chart colors and values with your actual data, then populate the right-side text boxes with your interpretation and insights.
-
Recommended For
Marketing teams, analytics departments, executive report managers, and customer presentation specialists seeking to support data-driven decision-making. Particularly effective for visualizing customer segmentation, market share, trend analysis, and competitive positioning.
-
Slide Structure
Two-slide layout with each slide featuring a left-side multi-layer circular chart (4-level data representation), center cloud icon, and right-side four icon-text boxes for item descriptions. Background colors alternate between sage green and charcoal gray for visual variety and clarity.
Related Products
-

Medical Illustration Customer Analysis Silhouette Graph – Visualizing Customer Psychology
#Market and Competitor Analysis #Graph #Other
-

Customer Analysis Slide by Gender
#Market and Competitor Analysis #Other #Customer Analysis
-

User Analysis Silhouette – Visualizing Customer Insights
#Market and Competitor Analysis #Other #Customer Analysis
-

Customer Analysis Segmentation Vertical Bar Graph – Market Insights and Business Strategy
#Market and Competitor Analysis #Graph #Customer Analysis
