Weather Forecast Infographic – A Presentation Template Emphasizing Visual Appeal
RJ0400044_17
- Last Update 05/28/2025
- File Size 0.4MB
- # of Slides 2
- File Format PPTX
- Slide Ratio 16:9
- Color
Keywords
About the Product
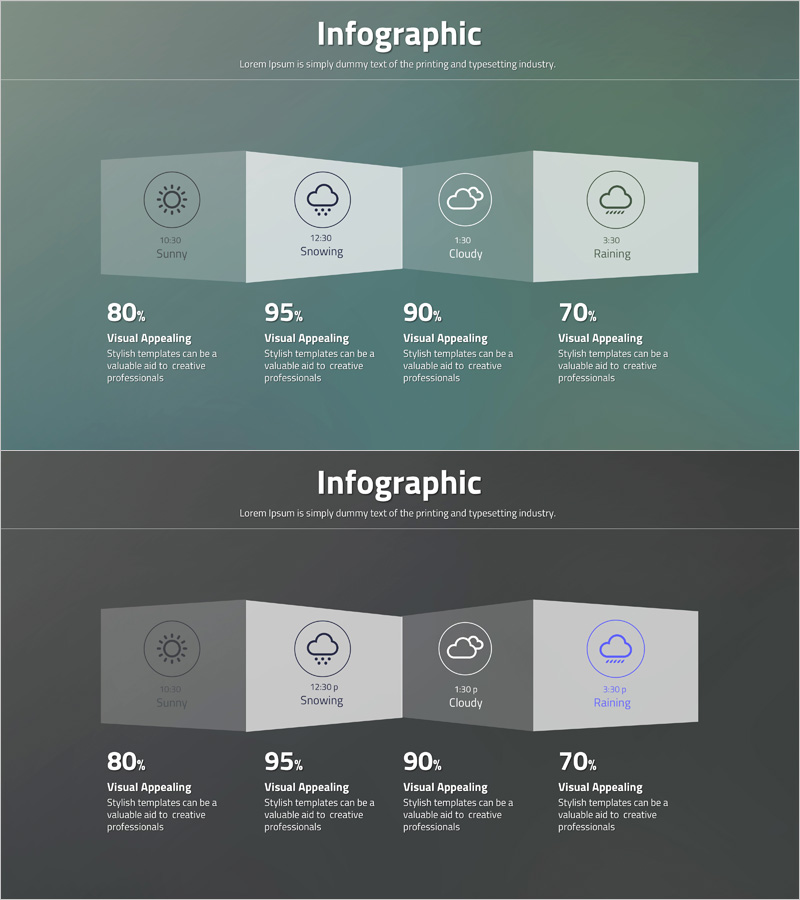
A weather forecast infographic PowerPoint slide that visualizes climate data with four weather icons and percentage values. This presentation template features sunny, snowing, cloudy, and raining conditions displayed as 3D cards with time labels, percentages, and descriptive text fields. The deck includes two slide variations: a teal-background version and a dark-gray-background version, both ready for immediate use in climate reports, environmental analysis, and weather briefings. Perfect for meteorologists, environmental professionals, and business analysts presenting statistical weather data in corporate presentations, academic reports, and sustainability initiatives.
Usage Points
-
Main Usage
Visualize climate and weather statistics in an intuitive, audience-friendly format that enhances comprehension and engagement. The parallel arrangement of weather icons and percentages enables quick comparison of weather frequency, probability, and impact across different time periods or regions.
-
How to Use
Apply this template when presenting meteorological data, environmental reports, or climate change analysis. Replace the sample time labels, percentages, and descriptions with your actual weather data. The two color variations allow you to match your presentation theme while maintaining consistent infographic structure.
-
Recommended For
Meteorologists, environmental specialists, marketing strategists, and educators presenting climate statistics, environmental impact assessments, or seasonal analysis. Ideal for government weather reports, academic presentations, corporate sustainability reports, and climate-related business briefings.
-
Slide Structure
Top slide features a teal background with four weather icons (sunny, snowing, cloudy, raining) arranged as 3D cards, each with time label, percentage value (80%, 95%, 90%, 70%), and descriptive text area. Bottom slide repeats the identical layout on a dark-gray background, providing color variation options for different presentation contexts.
Related Products
-

Human Details Infographic Chart – Customer Analysis and Market Overview
#Market and Competitor Analysis #Graph #Other
-

Gender Ratio Analysis Graph Chart – Data Visualization and Customer Insights
#Market and Competitor Analysis #Graph #Other
-

Dot Map Analysis Graph – Global Network and Target Market
#Company Introduction #Market and Competitor Analysis #Graph
-

Data Visualization Slide Template Featuring World Map
#Market and Competitor Analysis #Graph #Other
