Triangular Bar Graph for Future Outlook Analysis
RJ0300067_12
- Last Update 05/06/2025
- File Size 4.6MB
- # of Slides 2
- File Format PPTX
- Slide Ratio 16:9
- Color
Keywords
About the Product
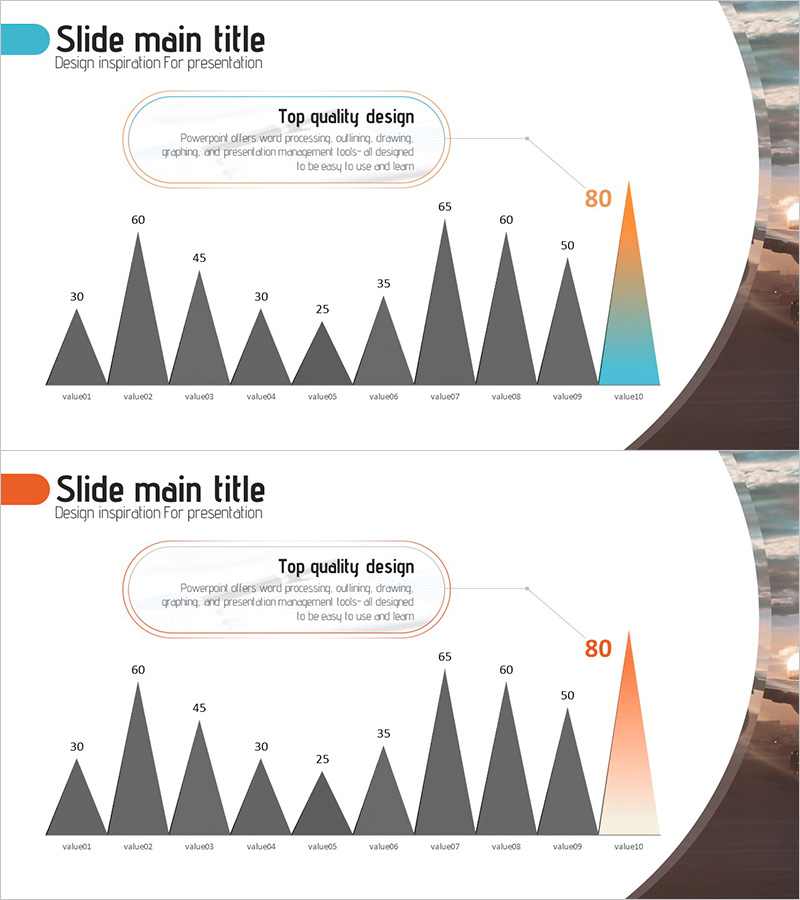
A triangular bar graph PowerPoint slide designed for future outlook analysis and data comparison. This presentation template visualizes 10 data points in triangular bar format, making it easy to compare values and identify trends at a glance. The final bar features an orange-to-teal gradient to highlight peak values or critical metrics. Ready to use for market analysis, competitive benchmarking, sales forecasting, and strategic planning presentations.
Usage Points
-
Main Usage
Compares 10 data points using triangular bar visualization, with gradient highlighting on the final bar to emphasize peak values or targets. Ideal for presenting market size trends, competitive performance metrics, revenue forecasts, and strategic growth indicators in business presentations.
-
How to Use
Adjust the height of each triangular bar to input your actual data values, then customize the title and legend to match your presentation context. Use in boardroom meetings or virtual presentations to support data-driven decision-making discussions and strengthen your analytical narrative.
-
Recommended For
Executive reports, quarterly performance reviews, market analysis seminars, investor presentations, strategic planning sessions, and competitive intelligence briefings. Particularly effective when emphasizing future projections or goal achievement metrics.
-
Slide Structure
Two-slide set featuring 10 triangular bars per slide. The first slide uses solid teal coloring, while the second applies an orange-to-teal gradient on the final bar for emphasis. Formatted in 16:9 widescreen ratio for modern presentation environments and seamless integration with contemporary display systems.
Related Products
-

Line Graph and Key Messages – Market Outlook Analysis
#Market and Competitor Analysis #Graph #Future Outlook
-

Rise and Fall Vertical Bar Graph – Essential for Market Analysis
#Market and Competitor Analysis #Graph #Future Outlook
-

Children's Education Area Graph – Market Trends Analysis
#Market and Competitor Analysis #Graph #Other
-

Eco-friendly Business Future Outlook Line Graph – Market Analysis
#Market and Competitor Analysis #Graph #Future Outlook
