Visual Trend Analysis Using Circle Diagram – Capturing Visual Appeal
RJ0400044_13
- Last Update 05/28/2025
- File Size 0.6MB
- # of Slides 2
- File Format PPTX
- Slide Ratio 16:9
- Color
Keywords
About the Product
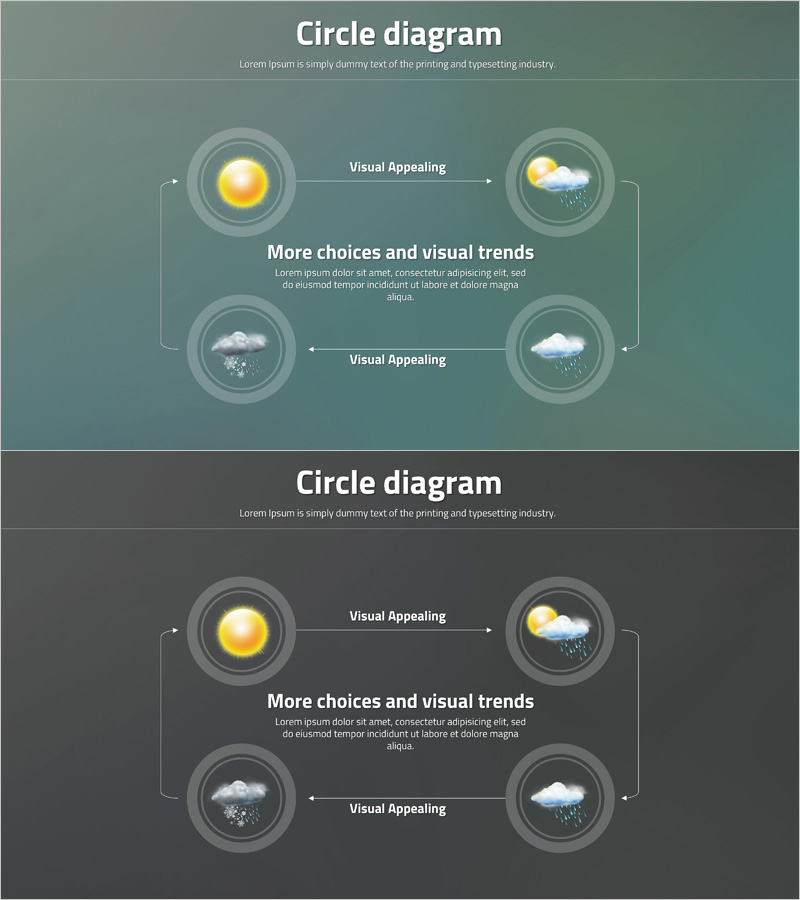
A 2-slide PowerPoint set featuring a 4-node circular diagram with teal background and connecting arrows. Each node contains a circular frame with weather icons (sun, cloud, rain) and connects to a central text area, creating a continuous cycle flow. The diagram is ideal for presenting cyclical processes, 4-stage iterations, and repeating workflows in business presentations. Provided in 16:9 widescreen PPTX format with fully editable text, colors, and icon placeholders for quick customization.
Usage Points
-
Main Usage
Visualizes cyclical processes, repeating workflows, and 4-stage iterations effectively. Perfect for illustrating marketing campaign cycles, product development iterations, seasonal patterns, customer journey loops, and any circular relationship or continuous process flow.
-
How to Use
Replace node text with stage names or phase titles, and add your core message in the center area. Customize icons to match your content theme and adjust colors to align with your presentation branding. The 16:9 aspect ratio works seamlessly with modern widescreen displays and projectors.
-
Recommended For
Marketing and planning teams presenting campaign cycles, operations teams visualizing repetitive processes, strategy teams analyzing circular structures, and educators explaining step-by-step learning flows. Suitable for business reports, proposals, strategic presentations, and training materials.
-
Slide Structure
2-slide set with each slide featuring a central text box surrounded by 4 circular nodes arranged clockwise. Directional arrows connect nodes to show continuous flow. Each node includes an icon placeholder. Two color variations provided: teal and charcoal backgrounds for design flexibility.
Related Products
-

Business Process Diagram – Communication Flow
#Operational Plan #Technical Approach #Diagram
-

Weather Flow Diagram – Advanced Technical Planning
#Operational Plan #Technical Approach #Diagram
-

Business Process Visualization Diagram Slide
#Operational Plan #Technical Approach #Diagram
-

Business Process Pentagon 3D Diagram – Visualizing Operational Plans
#Operational Plan #Technical Approach #Diagram
