Partner Business Process – Visualizing the Circular Diagram
RJ0300087_18
- Last Update 05/13/2025
- File Size 0.2MB
- # of Slides 2
- File Format PPTX
- Slide Ratio 16:9
- Color
Keywords
About the Product
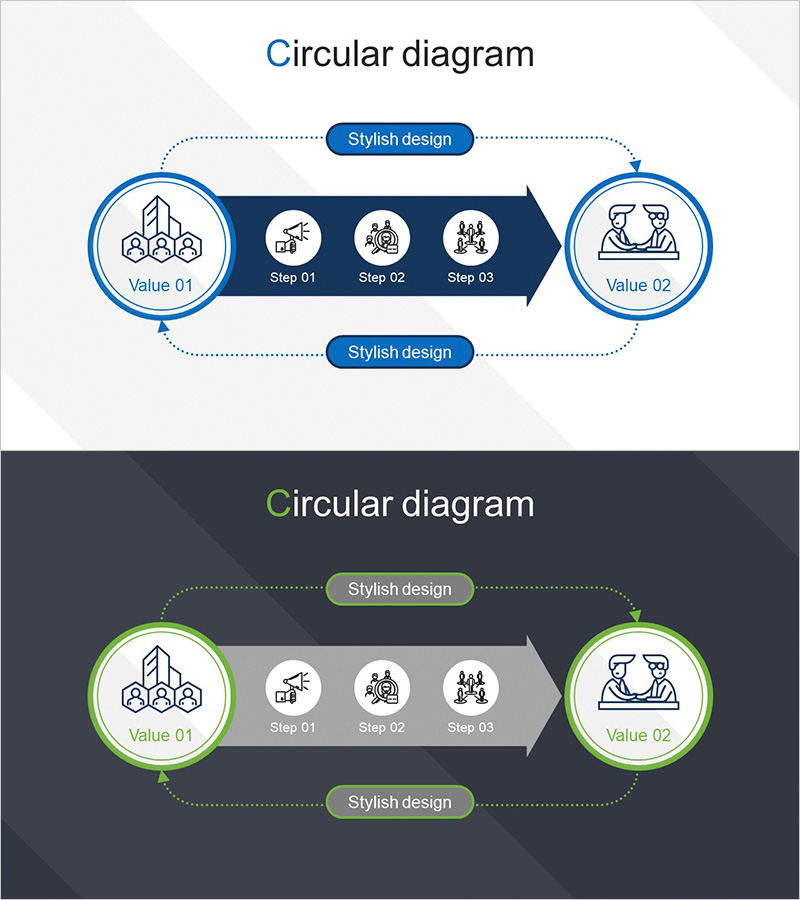
A PowerPoint slide that visualizes partner business processes using a bidirectional circular diagram structure. The flow moves from a left circular node (Value 01) through a central arrow containing three process steps (Step 01–03) to a right circular node (Value 02), then cycles back in reverse direction. Two color versions are included: blue and green schemes, each with icons at every step for clear information delivery. Available in 16:9 widescreen PPTX format with fully editable elements. Ideal for explaining inter-organizational collaboration, mutual interaction processes, and cyclical business models in presentations.
Usage Points
-
Main Usage
Visually represents mutual interaction and cyclical business processes between partner organizations. The bidirectional arrows and circular nodes clearly convey ongoing collaboration relationships and feedback loops, effectively communicating value exchange and step-by-step workflow between entities.
-
How to Use
Deploy in partnership sections of company presentations, collaboration model explanations in business proposals, and process flow pages in investment materials. Customize by entering company names or key values in the left and right circular nodes, and insert specific business activities in the three central steps to create tailored presentations.
-
Recommended For
Executives, business development teams, marketing professionals, consultants, and strategic planners explaining partnership strategies, supply chain management, and inter-organizational collaboration models. Particularly effective for B2B business proposals, strategic alliance presentations, and organizational cooperation structure explanations.
-
Slide Structure
2-slide set. Slide 1: Blue-scheme bidirectional circular diagram (left circular node → center 3-step arrow → right circular node → reverse cycle). Slide 2: Identical structure in green scheme. Icons positioned at each step; text input areas clearly defined.
Related Products
-

Business Process Diagram – Communication Flow
#Operational Plan #Technical Approach #Diagram
-

Business Process Visualization Diagram Slide
#Operational Plan #Technical Approach #Diagram
-

Business Process Pentagon 3D Diagram – Visualizing Operational Plans
#Operational Plan #Technical Approach #Diagram
-

Visual Trend Analysis Using Circle Diagram – Capturing Visual Appeal
#Operational Plan #Technical Approach #Diagram
