Table Design for Information Transfer – Emphasizing Visual Appeal
RJ0400044_12
- Last Update 05/28/2025
- File Size 0.5MB
- # of Slides 2
- File Format PPTX
- Slide Ratio 16:9
- Color
Keywords
- #Content-Based Slides
- #Design-Based Slides
- #Business Vision and Strategy
- #Market and Competitor Analysis
- #Diagram
- #Business Goals
- #Market Analysis
- #Table
- #Standard Table
- #16:9
- #data table PowerPoint slide
- #information visualization template
- #5-column table design
- #business report template
- #presentation table download
About the Product
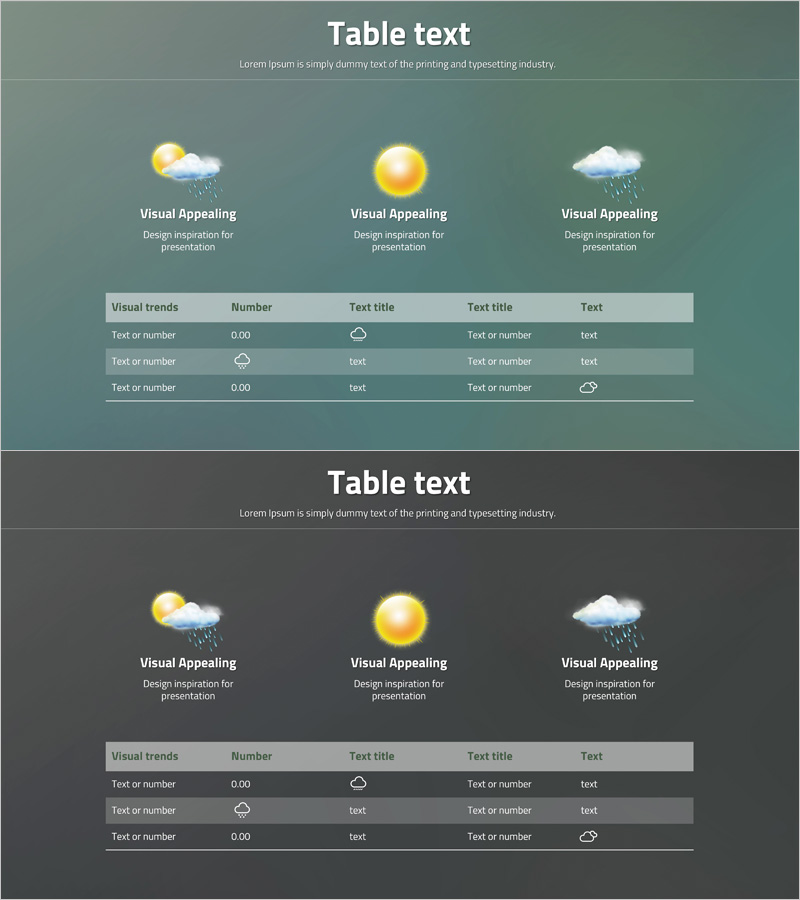
A professional data table PowerPoint slide set optimized for reports and proposals, featuring 2 slides with 5-column layout. The design uses a teal green header row and gray data rows to enhance readability and visual hierarchy. Each row includes input areas for numbers, text, and icons, making it ideal for presenting sales figures, performance metrics, cost breakdowns, and comparative analysis. Two slides feature different background colors—teal and charcoal—to create visual section separation and maintain audience engagement. Delivered in 16:9 widescreen PPTX format for seamless integration into modern presentation environments. Fully editable and ready to use for corporate reports, financial presentations, market analysis, and executive briefings.
Usage Points
-
Main Usage
Present quantitative data and performance metrics in a structured, easy-to-scan format that supports decision-making. Ideal for displaying sales results, quarterly performance, budget allocations, customer satisfaction scores, and comparative analysis across multiple categories.
-
How to Use
Enter column headers in the top row, then populate data rows with numbers, text labels, and icons. Place the table in the middle section of reports or comparison pages in proposals to draw audience focus. Customize row colors to highlight key metrics or use both slides to compare different data sets side by side.
-
Recommended For
Finance teams presenting quarterly earnings, marketing teams analyzing campaign performance, sales teams reporting customer metrics, and executives preparing strategic briefings. Particularly effective for B2B presentations, board meetings, and data-driven decision-making sessions where clarity and professionalism are essential.
-
Slide Structure
Two-slide set with teal background (Slide 1) and charcoal background (Slide 2). Each slide contains a 5-column table with header row and three customizable data rows for numbers, text, and icon placement. Formatted in 16:9 widescreen ratio for optimal display on modern screens and projectors.
Related Products
-

Weather Analysis Table – Market Analysis and Business Strategy
#Business Vision and Strategy #Market and Competitor Analysis #Diagram
-

Market Analysis Positioning Map – Market Power and Competitive Analysis
#Market and Competitor Analysis #Marketing Plan and Strategy #Diagram
-

Analyzing Market Share with 3 Donut Charts and Tables
#Market and Competitor Analysis #Diagram #Graph
-

Simple PowerPoint Wide Template Evaluation Table - Easily Compare Data
#Market and Competitor Analysis #Customer Success Stories #Diagram
