Target Country User Analysis Map
RJ0400040_9
- Last Update 05/28/2025
- File Size 0.6MB
- # of Slides 2
- File Format PPTX
- Slide Ratio 16:9
- Color
Keywords
- #Content-Based Slides
- #Design-Based Slides
- #Company Introduction
- #Market and Competitor Analysis
- #Graph
- #Other
- #Global Network
- #Target Market
- #Map
- #16:9
- #global map PowerPoint slide
- #world map presentation template
- #target country analysis slide
- #international business map PPT
- #market analysis map design
About the Product
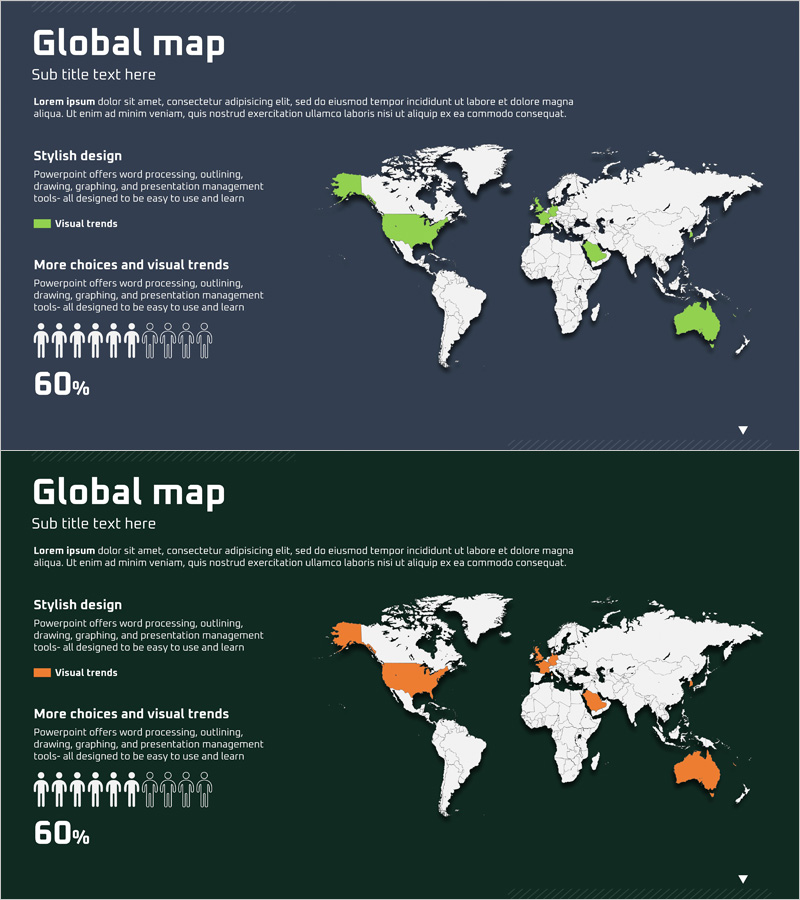
An essential world map PowerPoint slide for international business presentations. Featuring a dark gray and dark green background with white world map, this slide set highlights target countries in lime green or orange across two design variations. Each slide includes title, subtitle, and description text areas alongside a 60% statistics display zone, complemented by people icons and ratio graphics to visualize market size and user distribution. Ready-to-use for global network presentations, market analysis reports, and international strategy pitches.
Usage Points
-
Main Usage
Visually emphasize target countries and communicate market size and user distribution at a glance during international market entry and global business strategy presentations. Clearly express geographic scope and strategic focus in investor pitches, partnership proposals, and market analysis reports.
-
How to Use
Enter your analysis topic in the slide title (e.g., Global User Distribution, Target Market Expansion Plan), and describe regional characteristics and expansion strategies in the subtitle and description areas. Add numerical data and percentages to highlighted country regions, and display user scale in the people icon section to support data-driven decision-making.
-
Recommended For
International business managers, marketing strategy teams, investment relations professionals, and global expansion project leaders presenting market analysis, regional strategies, and partnership proposals. Ideal for multinational corporations, import-export companies, and global service providers in executive briefings and investor pitches.
-
Slide Structure
Two-slide set: Slide 1 features lime green country highlights, Slide 2 uses orange highlights. Each slide contains three text areas (title, subtitle, description), centered world map, statistics display zone (60%) in upper right, and bottom section with six people icons plus ratio graphics for data visualization.
Related Products
-

Check Pattern Template for Country Analysis – Global Market Insights
#Company Introduction #Market and Competitor Analysis #Graph
-

Target Area Status Analysis Graph – Data and Insights
#Company Introduction #Market and Competitor Analysis #Graph
-

Target Market Analysis World Map & Bar Graph
#Company Introduction #Market and Competitor Analysis #Graph
-

Target Country Analysis Map – Insights into Global Markets
#Company Introduction #Market and Competitor Analysis #Graph
