Target Market Analysis World Map & Bar Graph
RJ0400033_19
- Last Update 05/26/2025
- File Size 3.3MB
- # of Slides 2
- File Format PPTX
- Slide Ratio 16:9
- Color
Keywords
- #Content-Based Slides
- #Design-Based Slides
- #Company Introduction
- #Market and Competitor Analysis
- #Graph
- #Other
- #Global Network
- #Target Market
- #Column
- #Column Chart
- #Map
- #16:9
- #world map PowerPoint slide
- #global market analysis presentation
- #regional data visualization
- #bar chart template
- #international business slides
- #market comparison PPT download
About the Product
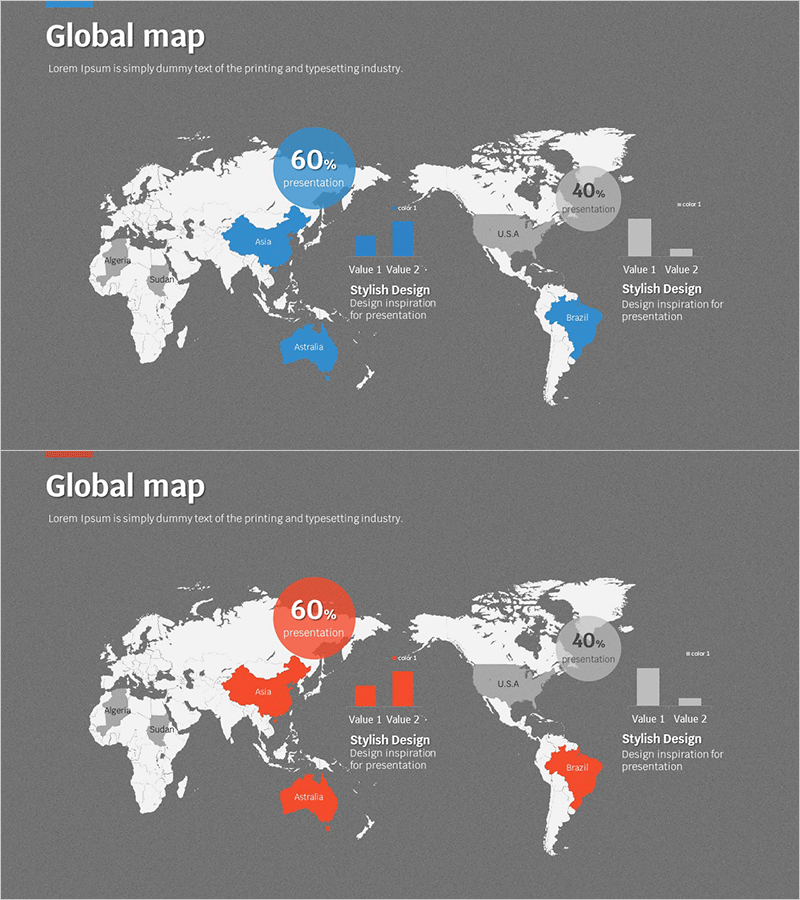
A two-slide PowerPoint presentation set for visualizing global market expansion strategy and regional performance analysis. The first slide features a dark gray background with a world map highlighting key regions (Asia, Brazil, Australia) in blue tones, accompanied by a 60% circular badge and Value 1·Value 2 bar graphs on the right side. The second slide uses the identical map layout with red color accents, enabling comparative analysis for competitive positioning or risk assessment presentations. Both slides include dedicated text areas for supplementary data and insights, optimized for 16:9 widescreen format to fit modern presentation environments and professional business contexts.
Usage Points
-
Main Usage
Designed for international business presentations including global market entry strategy, regional sales performance, competitive landscape analysis, and overseas business opportunity assessment. The combination of geographic visualization and quantitative bar graphs enables simultaneous presentation of location-based insights and numerical metrics, creating a comprehensive market analysis narrative.
-
How to Use
Use the first slide (blue tone) for positive market opportunities and growth potential, and the second slide (red tone) for risk factors and competitive threats. Edit the highlighted regions, Value 1·Value 2 labels, and the 60% badge with your actual market data. Both slides are fully editable and ready for immediate use in presentations after data customization.
-
Recommended For
Executive presentations on international expansion, marketing teams planning global campaigns, investor pitch decks for overseas business ventures, consulting firms delivering market analysis reports, trading companies sharing regional sales performance, and any business context requiring geographic data emphasis and regional comparison.
-
Slide Structure
Two-slide set with consistent layout: dark gray background + world map with regional highlights (Asia, Brazil, Australia) + 60% circular badge + right-aligned Value 1·Value 2 bar graphs + text annotation areas. Slide 1 uses blue accent color; Slide 2 uses red accent color for scenario-based comparative analysis.
Related Products
-

Country-by-Country Bar Chart Analysis – Market Trend Insights
#Company Introduction #Market and Competitor Analysis #Graph
-

Global Regional Analysis Vertical Bar Graph - Insights from Regional Data
#Company Introduction #Market and Competitor Analysis #Graph
-

Global National Goal Setting Map – Target Market Visualization
#Company Introduction #Market and Competitor Analysis #Other
-

Global Network Map – Market Analysis and Opportunity Exploration
#Company Introduction #Market and Competitor Analysis #Other
