Layout Design Presentation Template with Europe Map
RJ0200029_11
- Last Update 04/05/2025
- File Size 0.6MB
- # of Slides 2
- File Format PPTX
- Slide Ratio 16:9
- Color
Keywords
- #Content-Based Slides
- #Design-Based Slides
- #Company Introduction
- #Market and Competitor Analysis
- #Graph
- #Other
- #Global Network
- #Target Market
- #Circles
- #Pie Chart
- #Map
- #16:9
- #Europe map PowerPoint slide
- #geographic data visualization template
- #regional market analysis slide
- #pie chart map presentation
- #international business PowerPoint template
About the Product
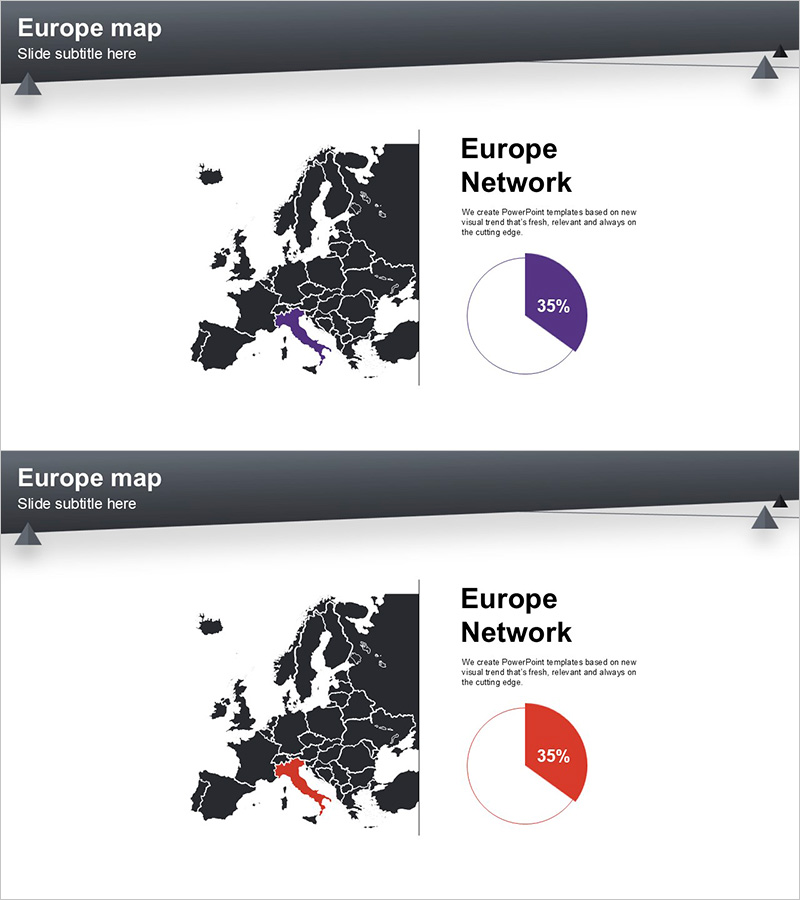
A geospatial data visualization PowerPoint slide combining a detailed Europe map with pie chart representation. The dark background map highlights specific countries or regions in purple and red, with a corresponding pie chart showing 35% ratio on the right side. This 2-slide set enables flexible regional selection for international business presentations, market analysis, and regional performance reporting. Optimized for 16:9 widescreen format and delivered as fully editable PPTX, allowing instant customization of data values and regional emphasis.
Usage Points
-
Main Usage
Visualize regional market share, sales volume, or customer distribution across Europe using integrated map and chart elements. Effectively communicate global business status, regional expansion strategy, and international performance metrics in executive presentations.
-
How to Use
Select the country or region to highlight on the dark background map and modify the accent color. Edit the pie chart values and legend to reflect actual regional data percentages. Customize title and descriptive text to align with your presentation context and business narrative.
-
Recommended For
International sales and marketing professionals, global enterprise regional performance reporting, overseas market expansion strategy meetings, multinational project status updates, and region-based business intelligence analysis presentations.
-
Slide Structure
2-slide layout featuring left-aligned Europe map with country borders and regional color highlighting, paired with right-aligned pie chart (single data series, 35% segment display, legend included). 16:9 widescreen format optimized for modern presentation environments and seamless integration with corporate templates.
Related Products
-

Target Country Analysis Map – Insights into Global Markets
#Company Introduction #Market and Competitor Analysis #Graph
-

Global Goal Achievement Rate Visualization – Insights Through Market Analysis
#Company Introduction #Market and Competitor Analysis #Graph
-

Target Market Global Network Map – Visualizing Business Strategy
#Company Introduction #Market and Competitor Analysis #Other
-

Global Network Map – Market Analysis and Opportunity Exploration
#Company Introduction #Market and Competitor Analysis #Other
