Navigation App Market Share Graph Analysis – Effective Data Visualization
RJ0400039_6
- Last Update 05/28/2025
- File Size 0.2MB
- # of Slides 2
- File Format PPTX
- Slide Ratio 16:9
- Color
Keywords
About the Product
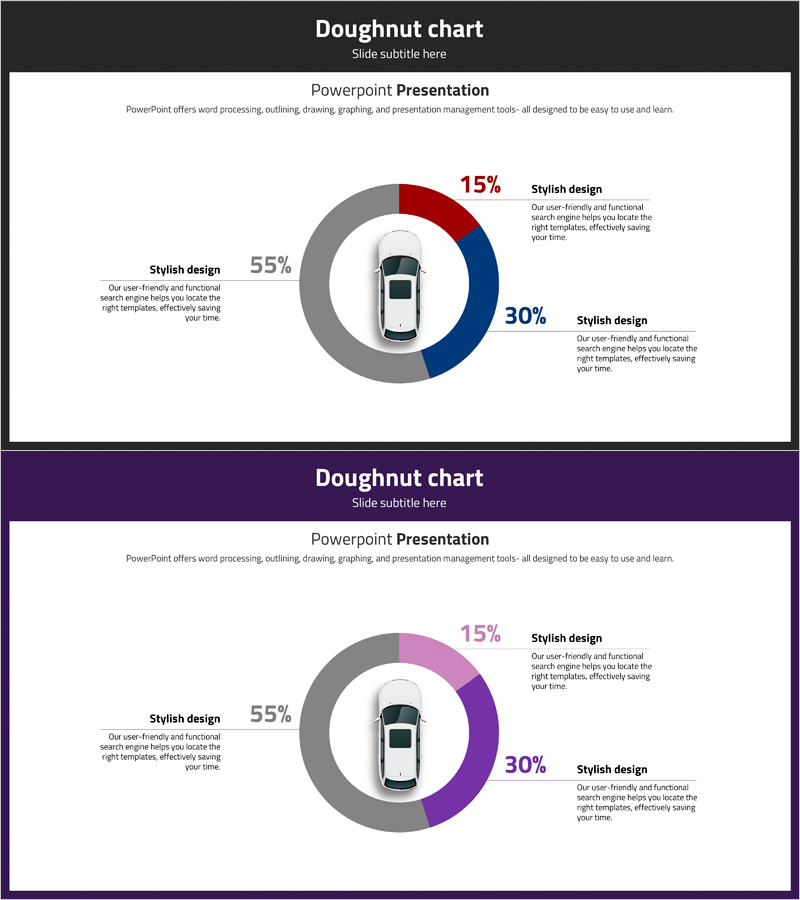
A doughnut chart PowerPoint slide that visualizes navigation app market share across three segments with percentages and descriptive labels. The design features a central icon surrounded by color-coded segments in dark gray, red, blue, and purple tones, with percentage values and explanatory text positioned around the chart. Each segment is clearly labeled and includes space for detailed descriptions. The 2-slide set provides color variations—one in dark tones and another in purple tones—allowing you to match your presentation theme. Fully editable shapes and text fields enable quick customization of data values and category names.
Usage Points
-
Main Usage
Effectively communicate market share distribution, sales ratios, customer segments, and composition percentages. The central icon space allows symbolic emphasis of the topic, while percentage labels and descriptions immediately convey data meaning to your audience.
-
How to Use
Use in executive reports, marketing analysis presentations, and business proposal market analysis sections. Replace percentage values with actual data, update segment labels to match your categories, and customize description text. Select the color version that best complements your presentation background—dark tone or purple tone variant.
-
Recommended For
Marketing professionals, business analysts, executives preparing data-driven reports, and market research specialists. Ideal for situations requiring quantitative explanation of app, service, or product market positioning and competitive landscape analysis.
-
Slide Structure
Three-segment doughnut chart with color-coded sections, percentage values, category labels, and detailed description areas. A central vehicle icon provides visual emphasis of the topic. Additional explanatory text is positioned on the left, right, and top areas. Both slides maintain identical structure with color variations—dark tone and purple tone versions for flexible design integration.
Related Products
-

Avocado Share Chart – Market Status and Competitive Analysis
#Market and Competitor Analysis #Graph #Other
-

Watercolor Customer Analysis Donut Chart – Visualizing Market Share
#Market and Competitor Analysis #Graph #Market Share
-

Market Share Donut Chart for Eco-Friendly Businesses – Trends and Insights
#Market and Competitor Analysis #Graph #Market Share
-

Travel Guide Business Goal Market Strategy Donut Chart – Market Share Analysis
#Market and Competitor Analysis #Marketing Plan and Strategy #Graph
