Market and Business Trends Visualization Graph
RJ0400017_14
- Last Update 05/21/2025
- File Size 0.2MB
- # of Slides 2
- File Format PPTX
- Slide Ratio 16:9
- Color
Keywords
- #Content-Based Slides
- #Design-Based Slides
- #Business Introduction
- #Market and Competitor Analysis
- #Graph
- #Market Status
- #Horizontal Bar
- #Segmented Horizontal Bar
- #16:9
- #100% stacked bar chart
- #horizontal bar graph PowerPoint
- #market trend analysis slide
- #business performance visualization
- #multi-series data chart
- #how to create stacked bar chart in PowerPoint
About the Product
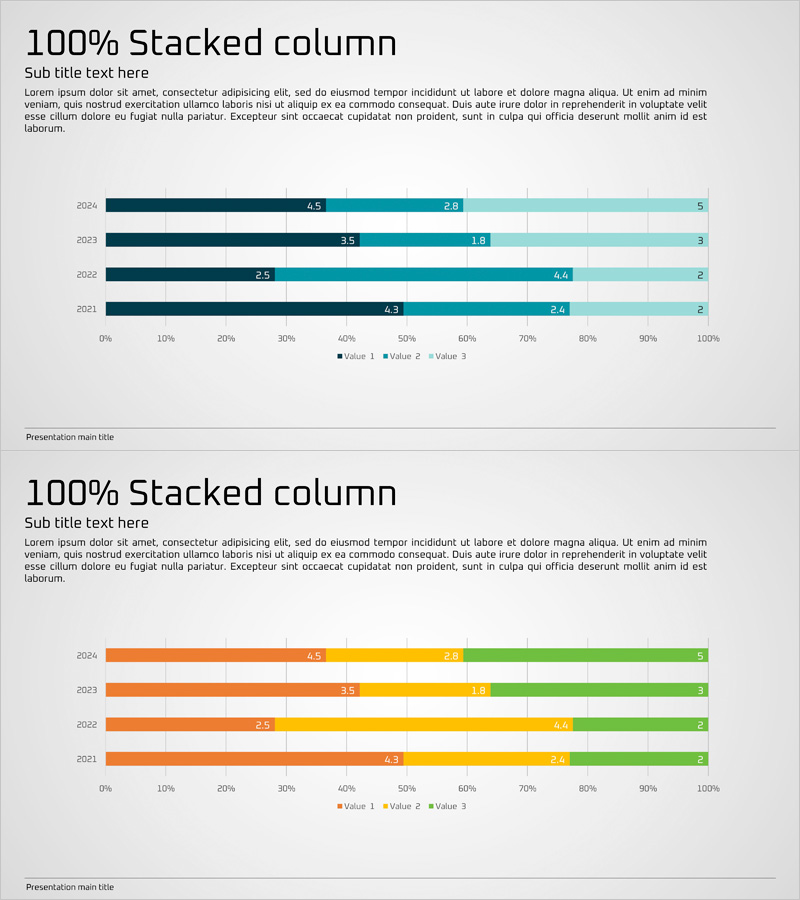
A 100% stacked horizontal bar chart PowerPoint slide that visualizes business and market trends across four years (2021–2024) with three data series. The design uses a cohesive color palette of dark blue, light blue, and sky blue tones to distinguish each series, making year-over-year proportion changes immediately visible. This presentation slide is ideal for market analysis, business performance reports, and investor presentations where comparative trend analysis is essential. Provided in 16:9 widescreen PPTX format with fully editable elements for seamless customization.
Usage Points
-
Main Usage
Displays year-over-year changes in business metrics or market share using a 100% stacked format, where each bar represents 100% and is divided into proportional segments. Ideal for executive summaries, investor pitches, and marketing strategy presentations where trend analysis and composition breakdown are critical.
-
How to Use
Update the numerical values in each colored segment of the bars to reflect your data. Replace the legend labels (Value 1, Value 2, Value 3) with your actual metric names, and modify the year labels as needed. Colors can remain as designed or be adjusted to match your corporate brand palette.
-
Recommended For
Executives, finance teams, marketing departments, and sales teams presenting quarterly or annual performance reviews. Particularly effective for illustrating market share evolution, revenue composition changes, customer segment distribution, or any multi-category proportion trend over time.
-
Slide Structure
Two-slide set featuring the primary design with dark blue, light blue, and sky blue color scheme on the first slide, and an alternative version with orange, yellow, and green tones on the second. Both slides display four years of data (2021–2024) stacked to 100%, with numerical labels positioned within each segment for clarity.
Related Products
-

Orange Green Highlight Bar Chart – Market Analysis and Marketing Strategy
#Market and Competitor Analysis #Marketing Plan and Strategy #Graph
-

Trade Market Analysis Graph – Visualizing Market Status
#Market and Competitor Analysis #Graph #Market Status
-

Technology Service Market Trends and Status – 100% Stacked Bar Chart
#Market and Competitor Analysis #Graph #Market Status
-

Family Camping Stack Horizontal Chart – Market Status and Competitive Advantage
#Market and Competitor Analysis #Graph #Market Status
