Competitive Advantage Graph by Field – Orange, Green, Purple
RJ0400038_18
- Last Update 05/27/2025
- File Size 4.1MB
- # of Slides 2
- File Format PPTX
- Slide Ratio 16:9
- Color
Keywords
- #Content-Based Slides
- #Design-Based Slides
- #Market and Competitor Analysis
- #Graph
- #Competitive Advantage
- #Other
- #Radar Chart Spider Chart
- #16:9
- #radial radar chart PowerPoint
- #5-axis analysis slide
- #competitive advantage diagram
- #radar chart template download
- #how to create radar chart in PowerPoint
About the Product
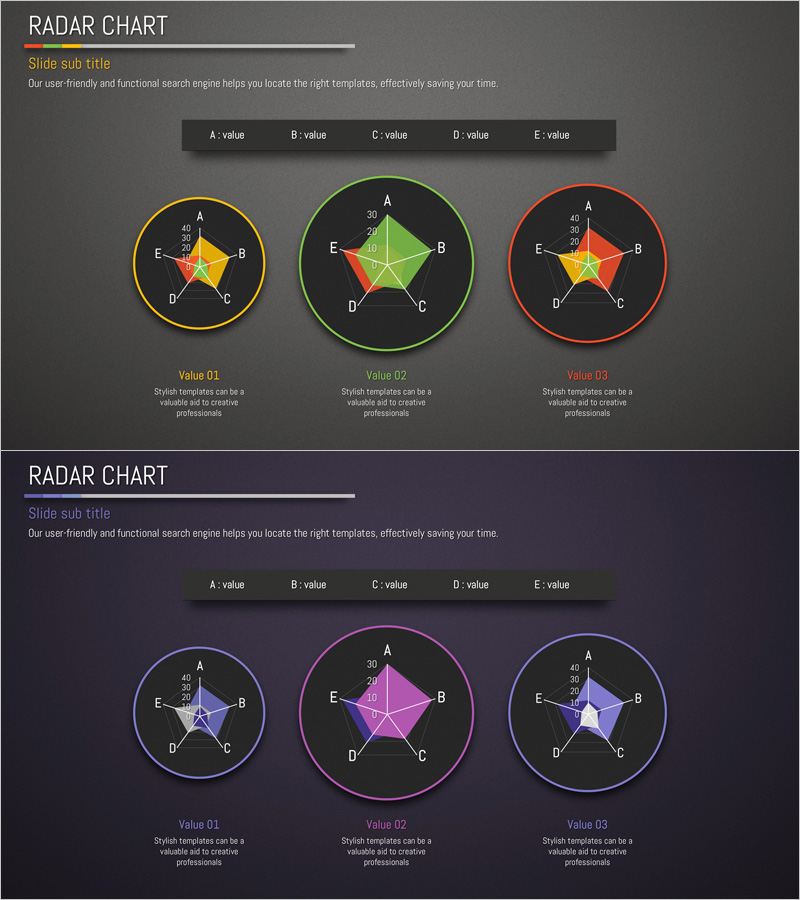
A radial radar chart PowerPoint slide featuring five axes for competitive positioning analysis. This presentation template uses three color schemes—orange, green, and purple—to visualize competitive advantages across multiple dimensions. Each axis (A, B, C, D, E) accepts customizable data values to represent market analysis, competitive benchmarking, capability assessment, or performance comparison. The two-slide set enables side-by-side scenario comparison, making it ideal for strategic presentations. Fully editable PPTX format allows quick customization of data, labels, and colors for immediate use in business reports and investor pitches.
Usage Points
-
Main Usage
Visualize competitive positioning by comparing your organization against competitors across five key dimensions, enabling clear identification of strengths, weaknesses, and market differentiation opportunities.
-
How to Use
Input evaluation criteria names on each axis (A through E) and enter data values between 0 and 40. The radar area automatically renders based on input values. Modify colors to represent different competitors, time periods, or business units.
-
Recommended For
Strategy and planning teams presenting market analysis, sales teams conducting competitive benchmarking, executive presentations on organizational capabilities, and consulting proposals requiring positioning analysis and capability assessment visuals.
-
Slide Structure
Two-slide layout with three radar charts per slide. The center chart displays all five axes with full data visualization, while left and right charts use single-color emphasis. Each chart includes Value 01, 02, 03 labels with descriptive text areas below for context and interpretation.
Related Products
-

Development Status Analysis Radial Graph – A Tool for Competitive Edge and Growth
#Product/Service Introduction #Market and Competitor Analysis #Graph
-

Two Radial Graphs for Product Feature Comparison – Highlighting Competitive Advantage
#Product/Service Introduction #Market and Competitor Analysis #Graph
-

Green Yellow Radial Chart
#Market and Competitor Analysis #Graph #Market Analysis
-

Comparable Filled Radial Chart – Intuitive Data Analysis
#Product/Service Introduction #Market and Competitor Analysis #Diagram
