Burnt Paper Theme Broken Line Graph – Market and Competitor Analysis
RJ0400037_12
- Last Update 05/27/2025
- File Size 5.7MB
- # of Slides 2
- File Format PPTX
- Slide Ratio 16:9
- Color
Keywords
- #Content-Based Slides
- #Design-Based Slides
- #Market and Competitor Analysis
- #Graph
- #Competitor Analysis
- #Line
- #Line Chart
- #16:9
- #line chart PowerPoint
- #trend analysis presentation slide
- #competitor analysis chart
- #market analysis graph
- #3-series line chart
- #data visualization PPT
- #PowerPoint line graph template
About the Product
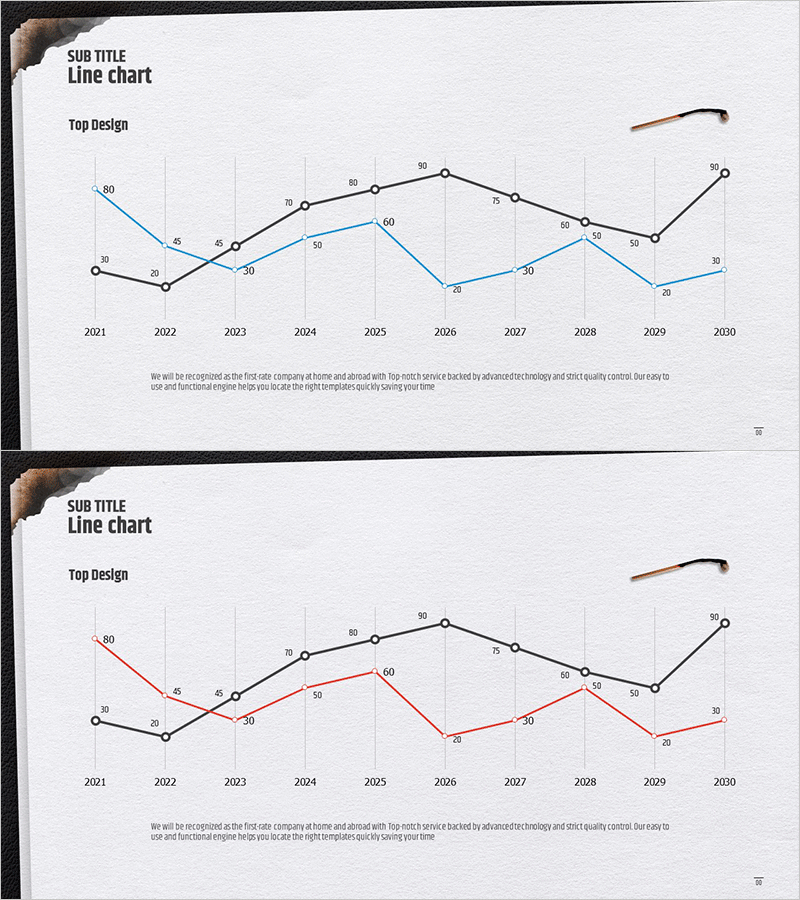
A professional line chart PowerPoint slide optimized for market analysis and competitor comparison. This presentation template displays data trends across three series from 2021 to 2030, featuring a premium burnt paper theme in brown tones. Each data point includes precise numerical labels for immediate presentation use. The 16:9 widescreen format with 2-slide composition clearly communicates market conditions and competitive dynamics. Unlike bar charts or pie charts, line graphs excel at visualizing temporal trends, making them ideal for analyzing growth rates, decline patterns, and market volatility. The burnt paper aesthetic adds credibility to business reports and executive presentations.
Usage Points
-
Main Usage
Visualizes numerical changes and trends over time by comparing multiple data series simultaneously. Particularly effective for displaying market share fluctuations, revenue trends, customer satisfaction changes, and competitive positioning. The intersection points of three lines highlight market shifts and competitive reversals.
-
How to Use
Insert into business reports, marketing strategy presentations, investor pitch decks, and executive briefing materials. Simply select the existing data and modify values, or rename series labels to reflect company names, regions, or product categories. The burnt paper background enhances business credibility, making it suitable for formal presentations.
-
Recommended For
Executives, marketing managers, business planners, financial analysts, and consultants analyzing market conditions, developing competitive strategies, and reporting performance metrics. Ideal for quarterly and annual performance comparisons, competitor benchmarking, and customer trend analysis.
-
Slide Structure
Slide 1: Three-series line graph (black, brown, and blue lines) spanning 10 years. X-axis shows years 2021–2030; Y-axis displays values 0–90. Numerical labels appear at each data point. Slide 2: Alternative color version (black, red, and brown series) with identical structure. Burnt paper background and brown accent lines maintain consistent design throughout.
Related Products
-

Infinite Energy Wide PPT Line Chart
#Market and Competitor Analysis #Financial Plans and Performance #Graph
-

Competitor Analysis Line Chart – Business Meeting Template Cover
#Business Strategy #Market and Competitor Analysis #Graph
-

Competitor Analysis Broken Line Graph
#Market and Competitor Analysis #Graph #Competitor Analysis
-

Blue Green Broken Line Graph – Optimized for Competitor Analysis Design
#Market and Competitor Analysis #Graph #Competitor Analysis
