Blue Red Market Analysis Area Graph
RJ0400037_10
- Last Update 05/27/2025
- File Size 7.2MB
- # of Slides 2
- File Format PPTX
- Slide Ratio 16:9
- Color
Keywords
About the Product
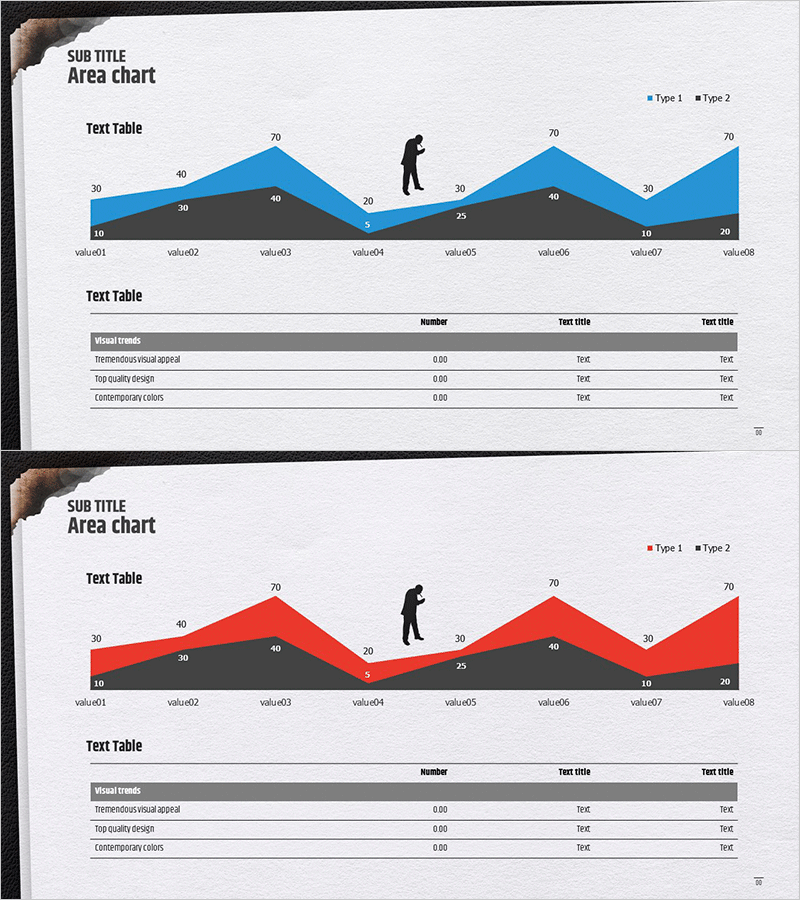
A professional area chart PowerPoint slide designed for market analysis and comparative data presentations. Features dual-series visualization with blue and red color schemes representing Type 1 and Type 2 across eight data points. Each slide includes a supporting text table below the chart with three rows for visual trends, differentiation strategy, and contemporary color insights. The 16:9 widescreen format spans two slides and is fully editable, making it ideal for investor pitches, executive briefings, and strategic marketing planning sessions. The stacked area format effectively communicates both aggregate trends and individual series performance simultaneously.
Usage Points
-
Main Usage
Visualizes time-series market data across two categories—such as market share trends, competitive positioning, or customer segment growth. The stacked area format allows simultaneous viewing of total market size and individual series contribution, providing clear decision-making insights for stakeholders.
-
How to Use
Input your actual data into the area chart in the upper section and populate the supporting text table below with analysis findings, strategic implications, and color-coding meanings. Retain the blue/red color scheme or customize with corporate brand colors to maintain visual consistency throughout your presentation.
-
Recommended For
Marketing professionals, executives, and investors presenting market analysis findings. Particularly effective for competitive benchmarking, market share evolution, customer segmentation analysis, and scenarios requiring side-by-side comparison of two data series over time.
-
Slide Structure
Each slide combines an upper area chart (8 data points, 2 series, legend included) with a lower 3-row text table (visual trends, differentiation strategy, contemporary color). Both slides maintain identical layout for cohesive analytical reporting.
Related Products
-

Market Trend Analysis Graph – Visualizing Market Status
#Market and Competitor Analysis #Diagram #Graph
-

Line Chart & Table – Market and Competitor Analysis
#Market and Competitor Analysis #Diagram #Graph
-

Market Analysis Segmented Bar Graph & Table Chart – Visualization of Competitive Analysis
#Market and Competitor Analysis #Diagram #Graph
-

Graph Chart for Analysis Comparison – Market and Competitor Analysis
#Market and Competitor Analysis #Diagram #Graph
