3D Printer Analysis Bar Graph
RJ0400036_9
- Last Update 05/27/2025
- File Size 0.8MB
- # of Slides 2
- File Format PPTX
- Slide Ratio 16:9
- Color
Keywords
- #Content-Based Slides
- #Design-Based Slides
- #Market and Competitor Analysis
- #Diagram
- #Graph
- #Future Outlook
- #Market Analysis
- #Cluster
- #Horizontal Bar
- #Chain Diagram
- #Horizontal Bar Chart
- #16:9
- #horizontal bar chart PowerPoint
- #bar graph slide template
- #data comparison chart
- #market analysis PowerPoint
- #competitive analysis slide
About the Product
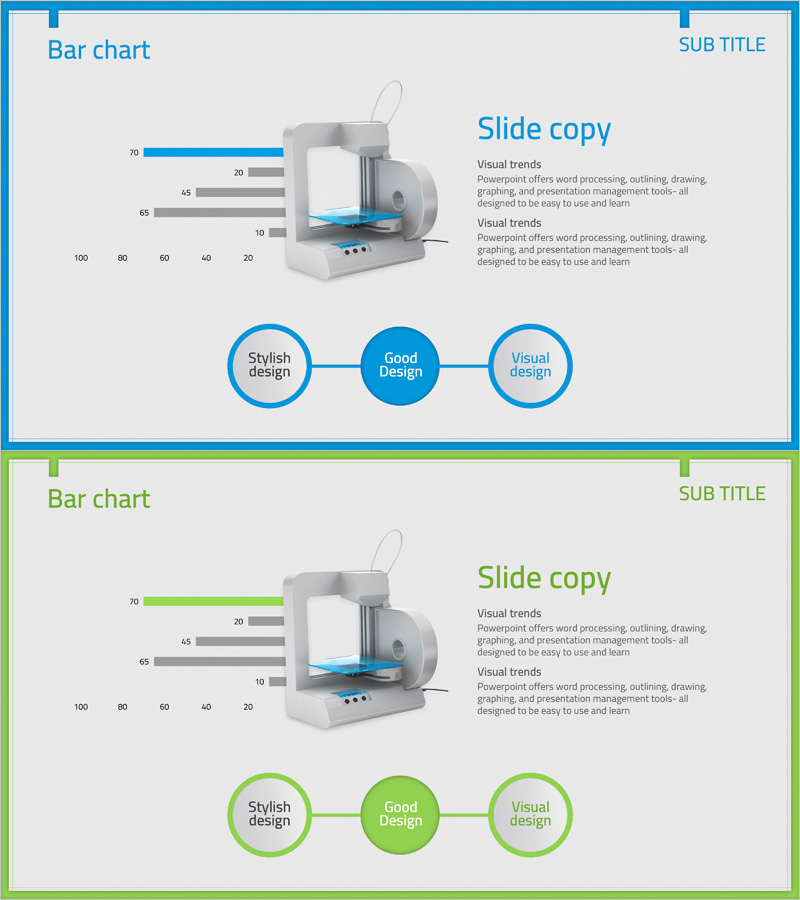
A horizontal bar chart PowerPoint slide designed for 3D printer market analysis and competitive benchmarking. This presentation template features four data items displayed side-by-side with blue accent bars and gray supporting bars on a light gray background. The layout enables clear visual comparison of metrics such as market size, competitor performance, and product specifications. The 2-slide set includes both the chart template and a practical usage example, allowing you to edit and apply the design immediately to your presentation. Delivered in 16:9 widescreen PPTX format for seamless integration into modern presentations.
Usage Points
-
Main Usage
Visualize and compare multiple data points—such as market size, competitor performance, or product specifications—using a horizontal bar format. The side-by-side layout makes numerical differences immediately apparent to your audience.
-
How to Use
Apply this template to industry analysis presentations, competitive benchmarking reports, product performance comparisons, and investor pitch decks. Simply replace the sample data and labels with your own figures to create a professional, data-driven slide.
-
Recommended For
Manufacturing and technology companies conducting market analysis, product development teams performing competitive research, investor presentations, and research institutions visualizing industry data.
-
Slide Structure
Slide 1: Horizontal bar chart with 4 data items (blue primary bars, gray secondary bars, 0–100 scale). Slide 2: Three connected circular nodes (Stylish design, Good Design, Visual design) linked by connector lines, with accompanying text area.
Related Products
-

Monthly Market Analysis with Horizontal Bar Chart – Shaping the Future of the Market
#Market and Competitor Analysis #Graph #Future Outlook
-

Successful Business Future Outlook Analysis Graph
#Market and Competitor Analysis #Diagram #Graph
-

Market Outlook Insights with Bar Graph – Visualizing Business Performance
#Market and Competitor Analysis #Graph #Future Outlook
-

Collaborative Business Market Revenue Analysis Graph - Data-Driven Insights
#Market and Competitor Analysis #Graph #Future Outlook
