Monthly Market Analysis with Horizontal Bar Chart – Shaping the Future of the Market
RM0200014_13
- Last Update 02/05/2025
- File Size 0.3MB
- # of Slides 2
- File Format PPTX
- Slide Ratio 16:9
- Color
Keywords
- #Content-Based Slides
- #Design-Based Slides
- #Market and Competitor Analysis
- #Graph
- #Future Outlook
- #Market Analysis
- #Horizontal Bar
- #Horizontal Bar Chart
- #16:9
- #horizontal bar chart PowerPoint
- #monthly market analysis slides
- #market environment template
- #data comparison chart presentation
- #bar graph PowerPoint template download
About the Product
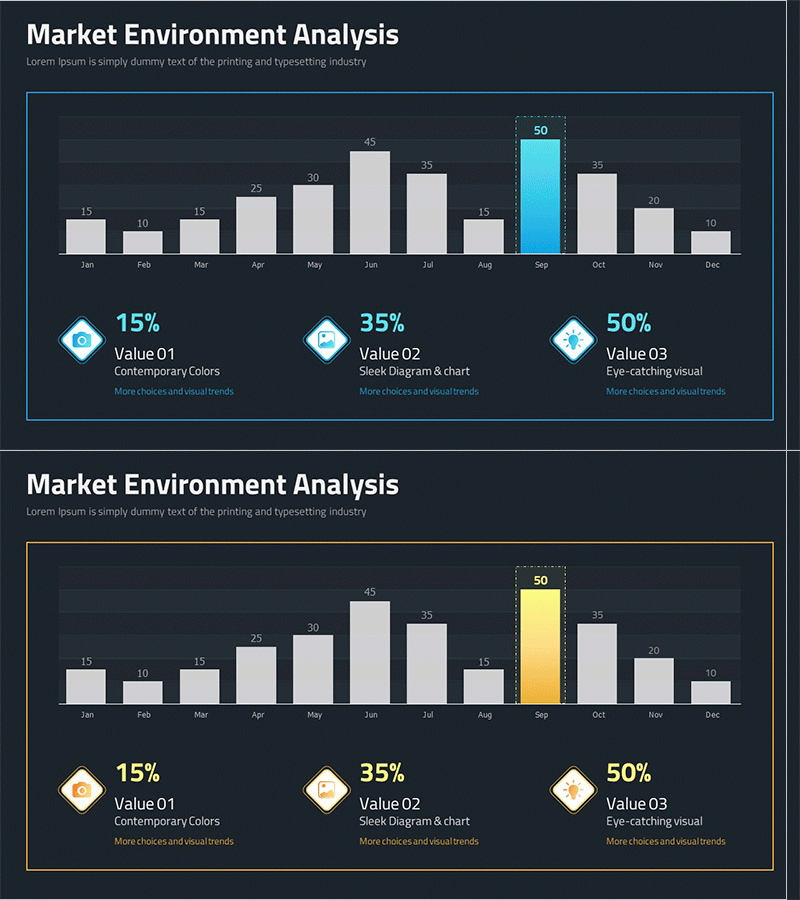
A professional PowerPoint slide set visualizing monthly market environment analysis using a 12-month horizontal bar chart. The design features a dark background with light gray bars and accent colors (cyan and yellow) to highlight key data points. Each slide combines the bar graph with three key performance indicators (Value 01, 02, 03) displayed with icons, enabling simultaneous presentation of quantitative metrics and qualitative insights. With 2 slides in 16:9 format, this template is ready for market analysis presentations, quarterly performance reports, competitive benchmarking, and strategic business communications.
Usage Points
-
Main Usage
Visualize monthly, quarterly, or annual market data using horizontal bar charts while simultaneously highlighting three key performance indicators to communicate market conditions and future outlook at a glance.
-
How to Use
Use in market analysis reports, quarterly performance presentations, competitive benchmarking sessions, and marketing strategy meetings to explain monthly trends and key metrics. Simply edit the bar values and indicator text with your own data for immediate use.
-
Recommended For
Marketing managers, executives, business planners, financial analysts, and consultants who need to present quantitative data-driven insights. Ideal for situations requiring simultaneous explanation of monthly trends and key performance indicators.
-
Slide Structure
Each slide contains a title area at the top, a 12-month horizontal bar chart in the center (with peak value of 50 highlighted), and three KPI boxes at the bottom (icon, percentage, label, and description). Both slides share identical layouts with color theme variations (cyan and yellow) for consistent data presentation.
Related Products
-

3D Printer Analysis Bar Graph
#Market and Competitor Analysis #Diagram #Graph
-

Market Outlook Insights with Bar Graph – Visualizing Business Performance
#Market and Competitor Analysis #Graph #Future Outlook
-

Successful Business Future Outlook Analysis Graph
#Market and Competitor Analysis #Diagram #Graph
-

Collaborative Business Market Revenue Analysis Graph - Data-Driven Insights
#Market and Competitor Analysis #Graph #Future Outlook
