Space Analysis Bundle Vertical Bar Graph – Market and Competition Analysis
RJ0400035_6
- Last Update 05/27/2025
- File Size 5.4MB
- # of Slides 2
- File Format PPTX
- Slide Ratio 16:9
- Color
Keywords
- #Content-Based Slides
- #Design-Based Slides
- #Market and Competitor Analysis
- #Graph
- #Competitor Analysis
- #Market Analysis
- #Column
- #Grouped Column
- #16:9
- #clustered vertical bar chart PowerPoint
- #2-series bar graph presentation
- #market analysis chart slide
- #competitor comparison template
- #data comparison PowerPoint slide
About the Product
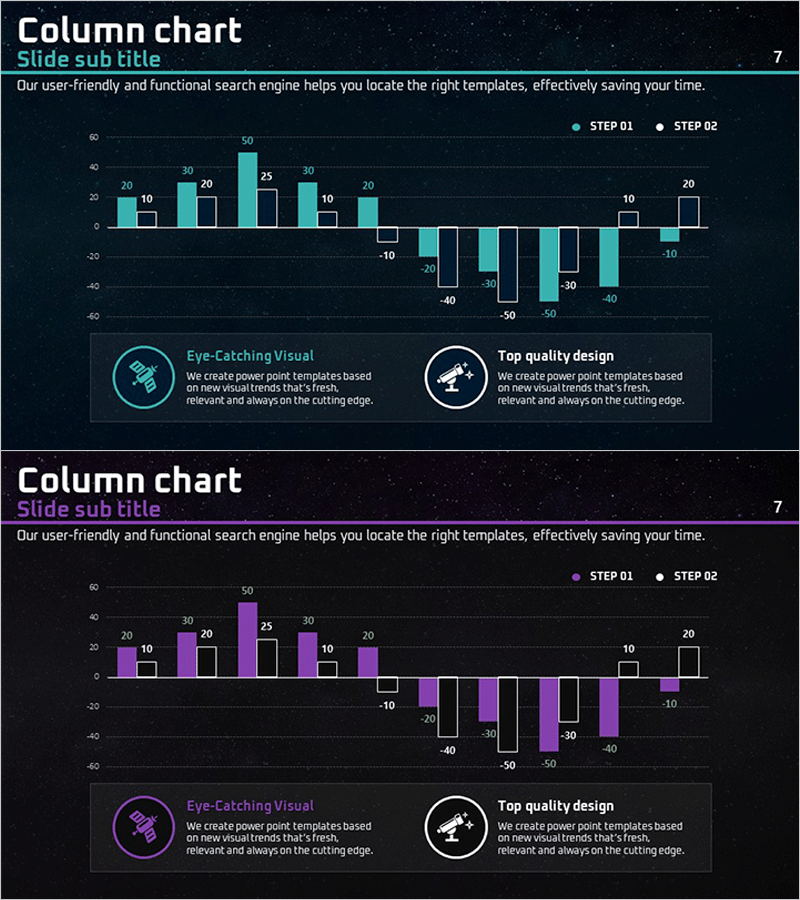
A clustered vertical bar chart PowerPoint slide optimized for market and competitive analysis presentations. Set against a dark space background, this slide features two data series in cyan and purple color schemes arranged side-by-side for intuitive item-by-item comparison. The 2-slide set presents the same data structure with different color combinations (cyan-black and purple-black) to suit various presentation contexts. Clear numerical labels on each bar enable immediate quantitative analysis, while the editable PPTX format allows you to modify data values, axis ranges, and legend labels freely.
Usage Points
-
Main Usage
Visualize two-series quantitative data such as market size, competitor performance, or quarterly revenue comparisons in marketing and strategy reports. Emphasizes differences across items clearly for executive briefings, investor presentations, and business analysis documents.
-
How to Use
Double-click bar heights and numerical labels to input your actual data values. Click the legend (STEP 01·STEP 02) to rename data series, and adjust colors via shape formatting options. Select and use both slides or choose the color combination that best fits your presentation theme.
-
Recommended For
Marketing, sales, and business planning professionals creating market analysis, competitive benchmarking, and quarterly performance comparison materials. Ideal for business plans, investor pitch decks, executive reports, and strategic planning presentations.
-
Slide Structure
Both slides follow identical structure: horizontal axis (8–10 items), vertical axis (0–60 range), clustered bars for 2 data series (heights 10–50), numerical labels above each bar, legend on right (STEP 01·STEP 02). Slide 1: cyan-black series / Slide 2: purple-black series.
Related Products
-

Business Competitor Comparison Analysis Graph – Effective Investment and Strategy Development
#Market and Competitor Analysis #Graph #Competitor Analysis
-

Laptop Mockup Bar Graph – Essential Slide for Competitor Analysis
#Market and Competitor Analysis #Graph #Other
-

Paper Theme Table Chart & Bar Graph – Market Analysis and Competitive Strength
#Market and Competitor Analysis #Diagram #Graph
-

Space Exploration Analysis Bar Graph
#Market and Competitor Analysis #Graph #Competitor Analysis
